

EQUITY: Low-income households are increasingly vulnerable to extreme heat, highlighting the urgency of ensuring equitable access to electricity and energy efficiency measures, advocates say. (Associated Press)
ALSO: Massachusetts awards $53 million — with plans for additional funding — to allow affordable housing operators to execute energy efficiency retrofits. (Energy News Network)
GRID:
HYDROGEN:
CLIMATE:
OIL & GAS:
ELECTRIC VEHICLES: A U.S. Senate committee this week discussed ways to help the domestic electric vehicle industry be more competitive globally. (States Newsroom)
NUCLEAR: A company developing a nuclear fusion prototype at a Tennessee nuclear plant raises capital from enthusiastic investors who see potential for an alternative to creating nuclear power from fission. (Knoxville News Sentinel)
COMMENTARY: A utility-funded California program says smart panel technology can help homeowners convert to electric appliances without expensive upgrades. (CalNEXT, sponsored)
Oregon’s plan to regulate fossil fuel companies and reduce greenhouse gases is ready for public comment after being derailed seven months ago by a lawsuit brought by natural gas companies.
Draft regulations for the state’s redo of the 2021 Climate Protection Program were published Tuesday by the Oregon Department of Environmental Quality. The agency gave the public until Friday, Aug. 30 to comment on them. The state’s Environmental Quality Commission, which oversees rulemaking for DEQ, is expected to vote on final rules by the end of the year, once again putting the state’s landmark climate change laws into action.
Little has changed from the original program standards, which were passed three years ago by the commission. The targets for reducing greenhouse gas pollution would remain the same. Under the proposed rules, Oregon would attempt to reach a 50% reduction in greenhouse gas pollution by 2035 and a 90% reduction by 2050 to confront the growing threat of climate change.
Fossil fuel companies would have to gradually decarbonize their energy supply, largely by shifting away from petroleum and natural gas and instead incorporating renewable energy sources such as wind, solar and so-called biofuels – made from captured gas and decomposing matter – into their energy offerings.
Natural gas is almost entirely methane gas, among the most potent climate-warming greenhouse gases that trap heat in the atmosphere. One-third of global warming is due to human-caused emissions of methane, according to the U.S. Environmental Protection Agency.
Under the newly proposed rules, some heavy energy users in the state would need to meet emissions reduction targets and companies would need to show compliance with the program every two years, as opposed to every three years in the original plan.
“We did build off of the work that we already did in the prior Climate Protection Program,” Nicole Singh, senior climate change policy advisor for DEQ, told the Capital Chronicle on Tuesday. “We didn’t throw that out the window. We’re using that information to help inform this.”
To give companies a little flexibility, they would be able meet some pollution reduction targets by purchasing credits sold by the state. Money from those credits are invested in projects that reduce greenhouse gas emissions.
Besides the three-year compliance schedule, the largest change to the newly proposed rules is who has to follow them.
The state, for the first time, would regulate the emissions of companies that are heavy natural gas users, not just the suppliers of their gas. These include some cement, fertilizer and gypsum producers. Gypsum is in plaster, drywall and some cement. Companies operating in Oregon, including cement maker Ash Grove and Georgia Pacific, which works with gypsum, would need to meet new emissions standards, Singh said.
The agency included other changes in the investment portion of the Climate Protection Program. This section covers what is ostensibly Oregon’s carbon crediting market, where polluters can offset some of their greenhouse gas emissions by investing in projects that reduce overall emissions. One credit would be equal to one metric ton of carbon dioxide released into the atmosphere, and companies could buy them for $129 per credit. This market, which would have begun operating this year, was previously projected to bring in $150 million a year for community decarbonization and renewable energy projects, according to the Portland-based nonprofit Seeding Justice, which had previously been tasked with overseeing the investments.
Credit recipients, largely nonprofits working on community-based projects, could use the grants to help people and businesses buy and install solar panels and heat pumps, purchase electric vehicles and chargers and help weatherize homes and buildings.
Under the proposed rules, Oregon’s nine federally recognized tribes would play a bigger role in determining grants and would receive more funding, according to Singh. It’s unclear yet what role Seeding Justice could play in distributing grants in the future, she said, because such details would follow final rulemaking.
The state would also take a fraction of the funding – about 4.5% – to pay for its oversight of the grants and to undertake internal and external auditing to ensure money is being spent appropriately and that projects are, in fact, reducing the amount of greenhouse gas emissions required.
Under the new rules, companies could offset 15% of their emissions through the purchase of these credits during the first two years of the Climate Protection Program and 20% during each two-year compliance period thereafter. Previously, companies could only offset 10% of their emissions through the credits in the first two years.
DEQ also proposes to work more closely with the Oregon Public Utilities Commission to understand how the Climate Protection Program will affect natural gas rates for Oregonians and to ensure companies aren’t passing all the costs of decarbonization on to their customers.
The Climate Protection Program was approved in 2021 by the Environmental Quality Commission after more than a year of meetings, presentations from the environmental quality department and public comment.
But in December, Oregon Court of Appeals judges agreed with lawyers representing NW Natural, Avista Corporation and Cascade Natural Gas Corporation, who argued that in the process of imposing state regulations to cap and reduce emissions, the commission failed to submit required disclosures to the companies and to other entities that hold federal industrial air pollution permits. The department was required to issue a written statement about why the state was adopting emission limits that exceeded federal rules, disclose a list of alternatives that were considered and explain why they were not adopted.
The judges ruled the program invalid on those technicalities.
Rather than appealing the decision to the Oregon Supreme Court, which would likely not hear the case until mid-2025, state environmental regulators announced in January that they would start over.
BRUSSELS — The European Union plans to pressure emerging economies such as China to contribute funding for climate action in developing nations at global negotiations in November, according to a document seen by POLITICO.
Financing is at the center of this year's United Nations climate conference, known as COP29, with developing countries clamoring for a significant increase in funds to help them cut emissions and prepare for the consequences of global warming.
The current funding pledge of $100 billion a year — which runs until 2025 and needs to be replaced with a new target at COP29 — is financed by countries classified as industrialized when the U.N. climate treaty was drawn up in 1992.
The EU is the largest contributor and intends to continue providing funding, but wants countries that have become wealthier in the past three decades to chip in as well, according to a draft of the bloc's COP29 position obtained by POLITICO.
In the document, dated July 26, the EU calls for an expansion of the target's "contributor base" reflecting the "evolving nature of respective capabilities" since the 1990s.
"Such broadening of contributions provides an opportunity to increase the finance to support the most vulnerable countries and communities and reflects strong global solidarity towards them," the draft paper continues. "In this context [the EU] CALLS on all countries according to their financial capabilities, including emerging economies, to contribute to the new goal."
The statement does not mention a specific country, but European diplomats and officials have sought to push Beijing in particular to contribute funding, given China has not only become the world's second-largest economy but also the top emitter of planet-warming greenhouse gasses.

Last week, senior German climate negotiator Jochen Flasbarth told POLITICO that rich countries would only step up funding if China starts paying up.
The draft position also suggests that the EU may push to limit the list of possible beneficiaries or direct more money to countries that are particularly vulnerable to global warming, rather than allow all countries classified as developing to access the same level of funding.
The bloc "stresses the importance" of setting up a new funding target "while taking into account the needs and priorities of the most vulnerable countries," such as island nations and members of a group known as the Least Developed Countries. The document shows that an earlier draft referred more broadly to "the needs and priorities of developing countries."
The fight reflects a dispute last year over whether China would donate to a fund to support damaged communities. China stared down the demands from the U.S., EU and their allies, despite the UAE breaking ranks and becoming the first country from outside the traditional donor group to give climate finance through an official U.N. fund.
That fund garnered around $655 million. The showdown in November scales up the financial stakes many times over — with some developing countries setting $1 trillion annually as their starting negotiating point — and is seen by European diplomats as a moment to fundamentally break with what they view as an outmoded distinction between rich and poor.
It is not only China that is seen as an able contributor. Wealthy Gulf states, with their own huge legacy of climate damage via sales of their fossil fuel reserves, such as Qatar, UAE and Saudi Arabia, are likely to be pressured to stump up. Singapore will likely receive pressure, as well.
In the draft document, the EU also suggests that the bulk of the new target can't come from national budgets, underlining that "private investments will have to undertake the largest share of the required investment in low emissions, resource-efficient and climate-resilient development."
The draft position, which was discussed by EU member country officials on Tuesday, is still expected to change before the summit starts in Azerbaijan on November 11. Officials will try to refine the text in September before handing the matter over to ministers.
EU finance ministers are expected to agree on the funding element of the position at their meeting on October 8, with the final COP29 position signed off by the bloc's environment ministers on October 14.
Karl Mathiesen contributed to this article.
Every increment of global warming above 1.5C increases the risk of crossing key tipping points in the Earth system – even if the overshoot is only temporary, says new research.
It is well established that if global temperatures exceed 1.5C above pre-industrial levels, there is a higher risk that tipping points will be crossed.
The new study, published in Nature Communications, investigates the risk of crossing four interconnected tipping points under different “policy-relevant” future emissions scenarios.
The authors investigate the risk of tipping where warming temporarily overshoots 1.5C, but global temperatures are then brought back down using negative emissions technologies. They find that the longer the 1.5C threshold is breached, and the higher the peak temperature, the greater the risk of crossing tipping points.
The most pessimistic scenario in the study sees global warming hit 3.3C by the end of the century – in line with the climate policies of 2020 – before dropping back below 1.5C over 2100-2300. Under this pathway, there is a 45% chance of crossing tipping points by 2300, the authors say.
The authors also warn that if global temperatures rise above 2C, the additional risk of tipping for every extra increment of warming “strongly accelerates”.
For temperatures between 1.5C and 2C, the risk increases by 1-1.5% for every 0.1C increase in overshoot temperature. However, for temperatures above 2.5C, tipping risk increases to 3% per 0.1C of overshoot.
The research “underlines the need for urgent emission cuts now that do not assume substantial carbon dioxide removal later”, a scientist not involved in the study tells Carbon Brief.
Scientists have warned for decades that as the planet warms, there is an increasing risk that Earth systems will cross “tipping points” – critical thresholds that, if exceeded, could push a system into an entirely new state.
For example, if climate change and human-driven deforestation push the Amazon rainforest past a critical threshold, large parts of the forest could experience “dieback”. This would cause entire sections of lush rainforest to eventually shift to dry savannah.
(See Carbon Brief’s explainer on the nine tipping points that could be crossed as a result of climate change.)
The planet has already warmed by 1.3C above pre-industrial levels, and a recent study warned that five tipping elements – including the collapse of the west Antarctic ice sheet – are already within reach.
That study emphasised the importance of limiting global temperature rise to 1.5C above pre-industrial levels – in line with the 2015 Paris Agreement. It finds that warming of 1.5C would render four climate tipping elements “likely” and a further six “possible”. Meanwhile, 13 tipping elements will be either “likely” or “possible” if the planet warms by 2.6C, as expected under current climate policies.
Many of the potential pathways to limiting global temperature rise to 1.5C by 2100 see the planet initially “overshoot” the threshold before negative emissions methods are used to bring temperatures back down.
The new paper investigates 10 future warming scenarios which run to the year 2300. The authors use the PROVIDE v1.2 emission pathways, which they describe as “an extended version of the illustrative pathways identified” used in the recent sixth assessment of the Intergovernmental Panel on Climate Change (IPCC).
The original scenarios run over 2015-2300, but the authors carried them forward for another 50,000 years by following the temperature trajectory set over 2290-2300. All scenarios stabilise at 1.5C, 1C or pre-industrial temperatures. However, many include overshoots, with peak temperatures ranging from 1.57C to 3.30C.
These scenarios show a range of options for how global temperatures change under these 10 scenarios in the “medium term” – until the year 2300 – as well as in the “long term”, which runs 50,000 years into the future to see how the planet eventually stabilises.
Scenarios that reach net-zero or negative emissions by 2100 and maintain them thereafter are classified as “NZGHG emission scenarios”. The table below gives more detail on each scenario.
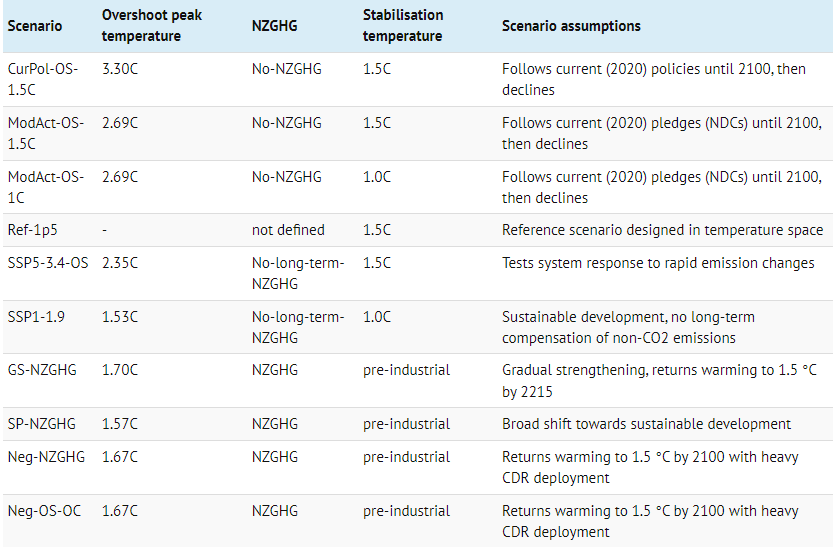
There is quite a range between the 10 pathways.
At the high end, the “CurPol-OS-1.5C” scenario sees a continuation of the global climate policies implemented in 2020 until the year 2100, with warming peaking at 3.3C. It then sees a decline in global temperature until reaching a stabilisation of 1.5C by the year 2300.
At the low end, “Neg-OS-0C” scenario initially overshoots 1.5C to 1.67C, but then returns warming to 1.5C by 2100 using “heavy carbon dioxide removal deployment”. It also then sees average global temperatures drop to pre-industrial levels by the year 2300.
In the middle, the Ref-1p5 scenario is the only one that does not include an overshoot, instead stabilising quickly at 1.5C.
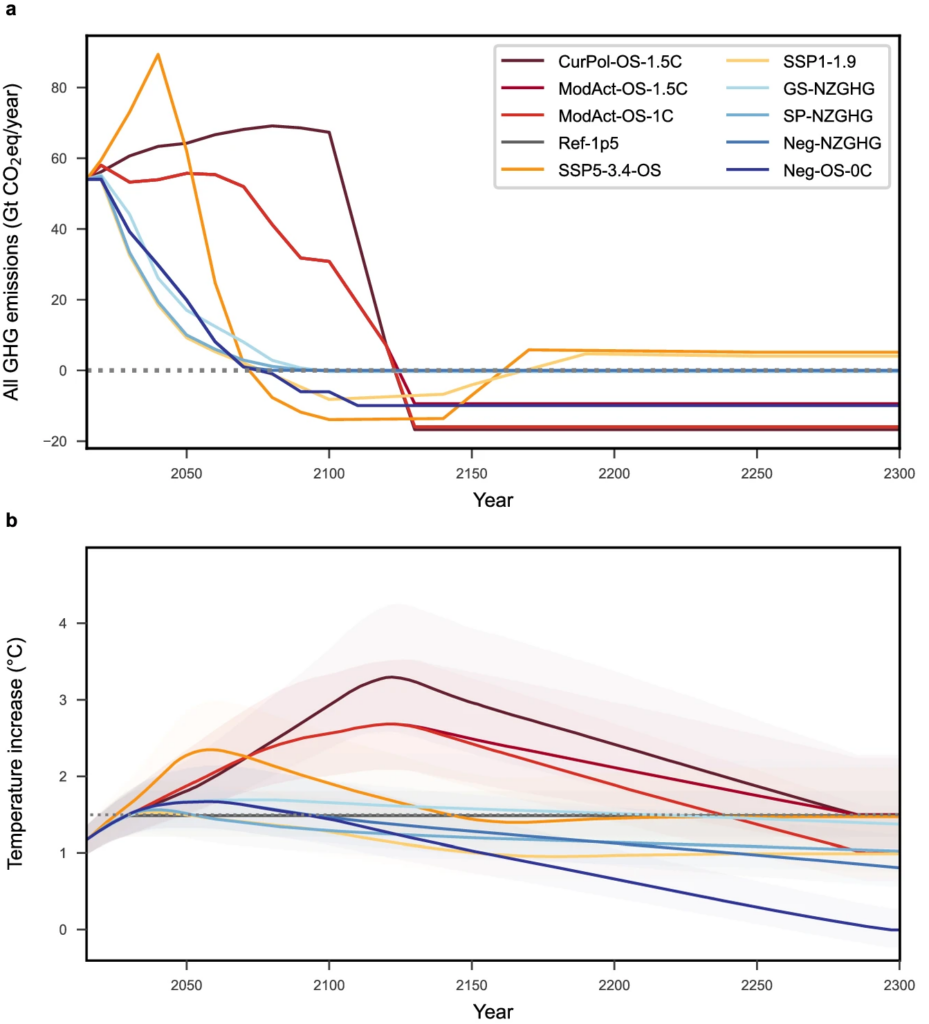
The chart below shows greenhouse gas emissions (top) and corresponding global temperature changes (bottom) associated with each scenario, identified by the different-coloured lines. The bottom chart illustrates the range in how quickly the pathways return to 1.5C or below.
Dr David McKay is a research impact fellow at the University of Exeter’s Global Systems Institute, who has published extensively on climate tipping points, but was not involved in this study.
He also notes that some of the scenarios shown in this study “may not be possible”, because there is debate about whether or not “the substantial carbon dioxide removal needed for large overshoots is feasible”.
Many Earth systems are interlinked, so crossing one tipping point can increase the likelihood of crossing others. This is often described as a “domino effect” or “tipping cascade”.
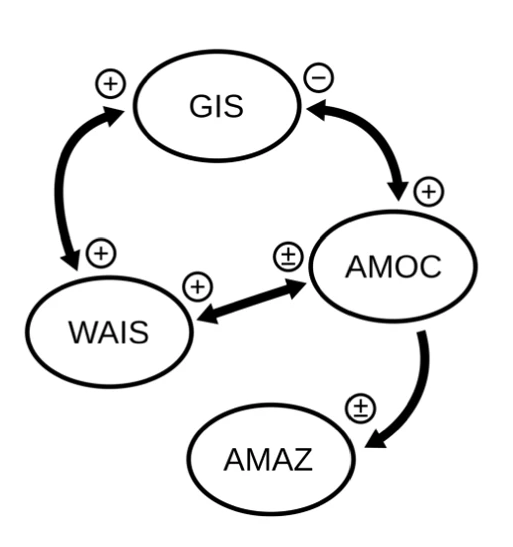
The study focuses on four interconnected tipping points – collapse of the Greenland ice sheet and west Antarctic ice sheet, shutdown of the Atlantic Meridional Overturning Circulation and dieback of the Amazon rainforest.
Annika Högner is a researcher at the Potsdam Institute for Climate Impact Research (PIK) and co-lead author on the study. She tells Carbon Brief these four tipping points were chosen because they “play a significant role in the functioning of the Earth system” and “their tipping would have severe global impacts”.
The graphic below shows how the tipping points interact with each other. A “+” symbol indicates that crossing one tipping point can destabilise another. For example, a collapse of the Greenland ice sheet makes the AMOC more likely to shut down, as a result of the sudden influx of freshwater into the north Atlantic Ocean. A “±” symbol indicates that the relationship between two tipping points is uncertain.
A “-” symbol indicates that crossing one tipping point stabilises another. Högner tells Carbon Brief that the interaction between the Greenland ice sheet and AMOC is the only stabilising interaction in this study. She explains that if the AMOC were to cross a tipping point, “we [would] expect to see strong cooling in the northern hemisphere”, which will contribute to stabilising the Greenland ice sheet.
Earth system models “often don’t resolve tipping processes very well”, making them less suited to modelling full tipping cascades, Högner tells Carbon Brief.
Instead, she explains that the authors developed a “conceptual model”. This model does not attempt to simulate the entire Earth system, but instead just models the likelihood of tipping at different temperatures, based on existing knowledge about tipping elements from other studies.
The model takes temperature trajectories as an input and gives the state of the tipping elements after a specified time – that is, whether or not the element has tipped – as an output.
Importantly, these models include “hysteresis” – a feature of tipping systems, in which a system that has moved to a different state does not easily move back to the original state even if temperatures are reduced again.
The authors use their conceptual model to calculate “tipping risk” under the 10 future warming scenarios. Högner tells Carbon Brief that tipping risk “refers to the model of all four interacting tipping elements analysed in the study”. For example, a 50% tipping risk means there is a 50% chance that at least one of the four climate elements will tip.
The top row of the graphic below shows the risk of tipping in the year 2300 (left) and in 50,000 years from now (right). Bars placed higher up indicate a greater likelihood of tipping. The dot shows the average value for each data point, while the bars show the 10-90% range.
The text on the right hand side gives likelihood levels in the calibrated language used by the IPCC: very likely means a likelihood of 90-100%, likely is 66-100%, about as likely as not is 33-66%; unlikely is 0-33%; and very unlikely is 0-10%.
The middle row shows the peak temperature under each scenario (left) and stabilisation temperature (right). The bottom row shows how long temperatures overshoot before stabilising in each scenario.
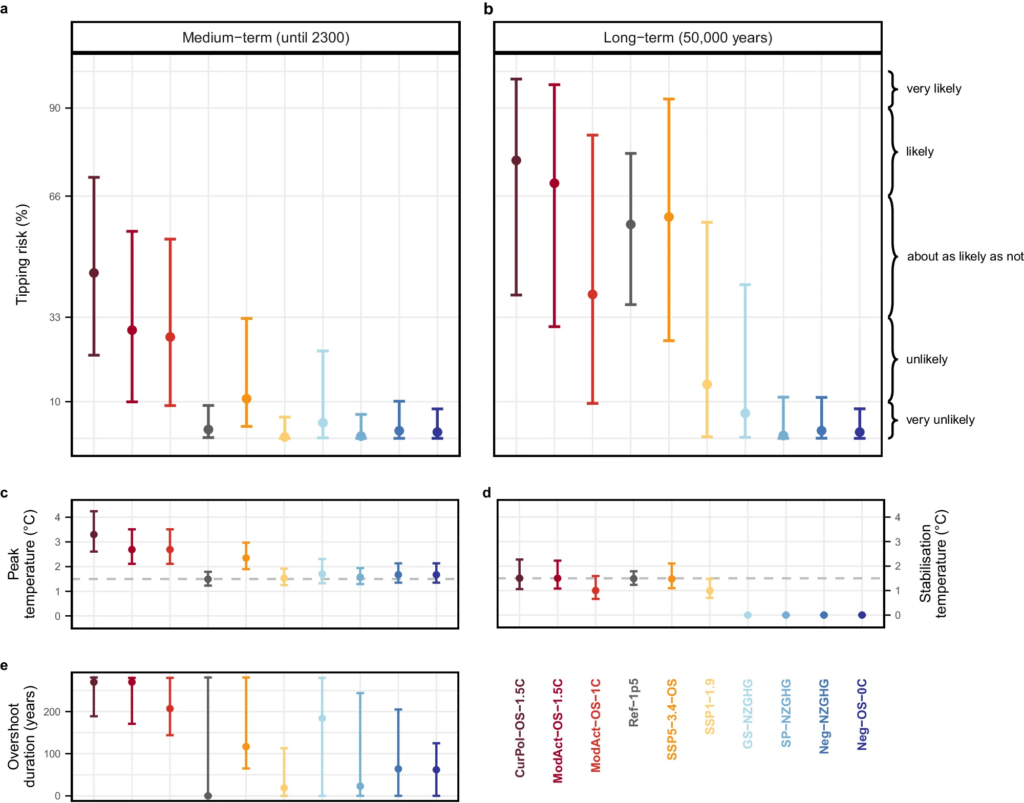
The longer the 1.5C threshold is breached for, and the higher the peak temperature is, the greater the risk of crossing tipping points by the year 2300, the study shows.
The authors find the greatest risk of crossing tipping points in the CurPol-OS-1.5C scenario (red), which follows the climate policies of 2020 until the year 2100 and then reaches 1.5C by 2300, as this scenario has the greatest overshoot temperature and duration.
Under this scenario, there is a 45% tipping risk by 2300 and a 76% chance in 50,000 years, according to the paper.
The five pathways that do not return warming to 1.5C by the year 2100 have the greatest medium-term risks, and those with less than 0.1C overshoot have the lowest medium-term risks.
In the long-term – looking to the next 50,000 years – the authors find that stabilisation temperature is “one of the decisive variables for tipping risks”. They find that even in the Ref1p5 scenario – which sees global temperatures stabilise at 1.5C without any overshoot – there is a 50% risk of the system tipping over the next 50,000 years.
The results “illustrate that a global mean temperature increase of 1.5C is not ‘safe’ in terms of planetary stability, but must be seen as an upper limit”, the study warns.
Högner tells Carbon Brief that the paper “underlines the importance of adhering to the Paris Agreement temperature goal”.
Tessa Möller – a researcher at the International Institute for Applied Systems Analysis (IIASA) and co-lead author on the paper – tells Carbon Brief that “we have a wide portfolio of technologies available” to limit warming to 1.5C, and just need to “implement” them.
However, she also highlights the “large credibility gap” between pledges from individual countries and the policies they have actually implemented. She tells Carbon Brief that not only do we need “stronger pledges”, but it is also essential that countries follow through on them.
The authors also explore the risk of each individual tipping point being crossed in different scenarios.
The plot below shows the tipping risk by 2300 under different scenarios, at different temperatures, on the left. Each colour represents one scenario. Dots positioned further to the right indicate a greater peak temperature and dots positioned higher up indicate a greater tipping risk.
The plot on the right shows the percentage change in tipping risk for every additional 0.1C of overshoot, for different peak global temperatures, for the Amazon (cross), AMOC (plus), West Antarctic ice sheet (black dot) Greenland Ice sheet (square) and overall (yellow dot).

The authors find that AMOC collapse and Amazon dieback would likely be the first components to tip. This could be in the next 15-300 years and 50-200 years, respectively, depending on the scenario, they find.
Meanwhile, the Greenland and west Antarctic ice sheets have tipping timescales of 1,000-15,000 years and 500-13,000 years, respectively.
However, they note that as temperatures increase, the relative risk of each element tipping changes. The graph shows that while AMOC is the main driver of tipping risk at lower temperatures, the Amazon becomes the main driver once global temperatures exceed 2C.
Finally, they find that as global temperatures rise, the risk of tipping accelerates. Overall, tipping risk increases by 1-1.5% per 0.1C increase in overshoot temperature, for temperatures below 2C, according to the study. However, above 2.5C, tipping risk increases to 3% per 0.1C increase overshoot.
McKay notes that there are some limitations in the study. For example, he notes that the paper “has to rely on tipping threshold and timescale estimates with often wide ranges and sometimes low confidence, while tipping interaction estimates are based on dated expert judgement”.
However, he adds:
“This work makes it clear that every fraction of warming increases the chance of tipping points, even if global temperature subsequently falls, and underlines the need for urgent emission cuts now that do not assume substantial carbon dioxide removal later.”
CLIMATE: The U.S. EPA awards Western states more than $1.27 billion for projects aimed at reducing greenhouse gas emissions from transportation, utilities, buildings and industry. (Associated Press, Colorado Newsline)
ALSO: A study finds the urban heat island effect increases Tucson, Arizona’s temperature by nearly eight degrees over that of the surrounding, undeveloped desert. (Arizona Daily Star)
UTILITIES: Hawaiian Electric and other defendants reportedly agree to pay $4 billion to settle lawsuits over last year’s deadly Maui wildfires, but disagreements over distribution of the funds is delaying a final deal. (Honolulu Star-Advertiser)
WIND:
SOLAR:
ELECTRIFICATION:
GEOTHERMAL: The U.S. Army looks to heat an Alaska base with geothermal energy. (Task & Purpose)
HYDROGEN: Navajo Nation advocates push back against a proposed 200-mile hydrogen pipeline that would cross tribal land, saying existing regulations are inadequate to ensure safety or mitigate impacts. (Arizona Republic)
OIL & GAS:
COAL:
GRID: Unusually severe winds topple utility poles in eastern Idaho, leaving nearly 8,000 customers without power. (East Idaho News)
CLIMATE: The U.S. and other wealthy western countries are the best-equipped to curb pollution and build out renewables, but have still committed to fossil fuel projects that could release 12 billion tons of planet-warming emissions over their lifetimes. (The Guardian)
ALSO:
POLITICS:
BUILDINGS: The U.S. General Services Administration, which runs the nation’s federal buildings, is using Inflation Reduction Act funding to decarbonize its infrastructure and derisk new technologies that can help other buildings cut their emissions. (Canary Media)
RENEWABLES: While new state measures and federal funds are helping smooth the way for substantially more solar in Pennsylvania, “fossil fuels aren’t going anywhere” amid pro-carbon capture and hydrogen production policies. (Spotlight PA)
CARBON CAPTURE: Members of a Louisiana task force won’t discuss why the group is five months late issuing a report on the impacts of building out carbon capture, leading critics to charge that the state has embraced the fledgling industry without due diligence. (Floodlight)
OIL & GAS:
PERMITTING: Democratic Sen. Martin Heinrich steps behind the latest attempt at permitting legislation, saying it would speed the buildout of transmission lines, geothermal power, and other renewable energy. (E&E News)
COAL: Ratepayers in grid operator MISO’s territory paid $1.1 billion more for electricity than they should have over the past three years as utilities ran coal plants to meet demand instead of cheaper, cleaner alternatives, according to a Natural Resources Defense Council report. (E&E News, subscription)
As 2024 passes its midpoint, the global climate continues to push into uncharted territory.
Carbon Brief’s analysis indicates a 95% probability that this year will surpass 2023 as the warmest year on record in the Copernicus/ECMWF ERA5 dataset.
This projection emerges amid a series of climate extremes that have marked the first half of 2024.
In the latest “state of the climate” quarterly update, Carbon Brief assesses the first full six months of 2024 and finds:
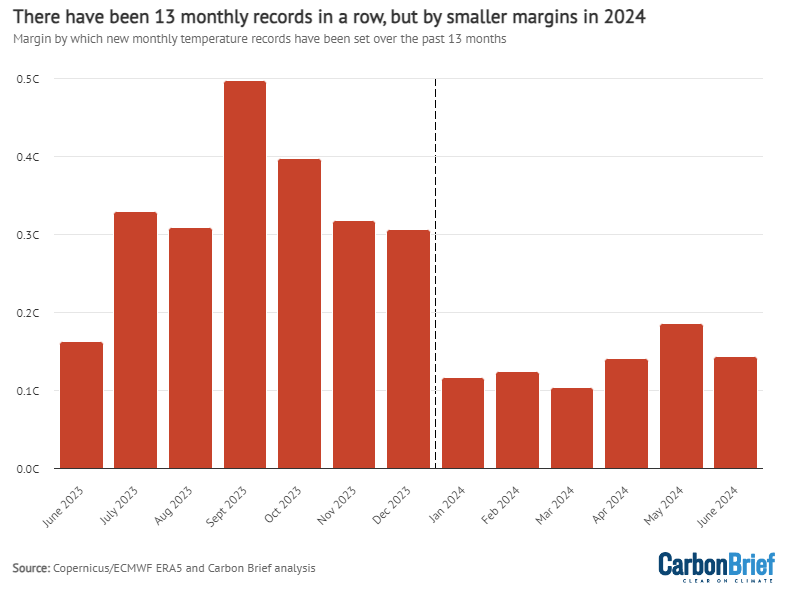
Global temperatures set a new record for each of the first six months of 2024, extending what was already a string of seven record setting months in 2023.
All in all, each of the last 13 months has been the warmest since records began in the mid-1850s.
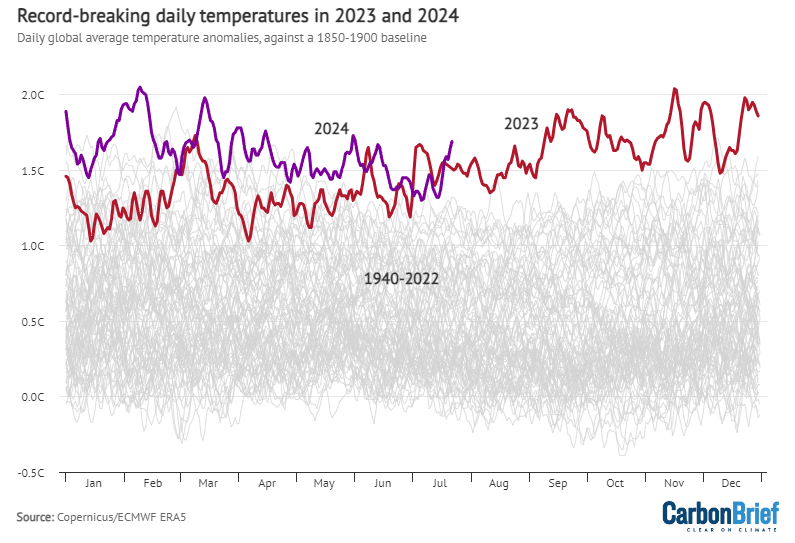
The figure below shows how global temperature so far in 2024 (purple line) compares to each month in different years since 1940 (with lines coloured by the decade in which they occurred) in the Copernicus/ECMWF ERA5 surface temperature dataset.
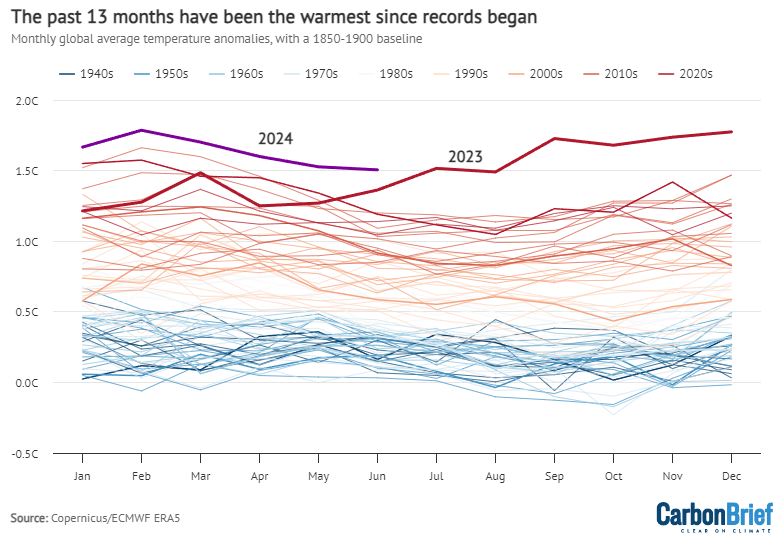
Global temperatures in the latter half of 2023 exceeded prior records by at least 0.3C, peaking in September when 2023 surpassed the previous September record by 0.5C. While 2024 has continued to set records, the margins have been smaller:
It is important to note that June 2024 is being compared to the already high temperatures set in 2023. Compared to the last major El Niño event in 2016, June 2024 was about 0.4C warmer.
The figure below shows the margin by which global temperatures were set in each of the prior 13 record-setting months.
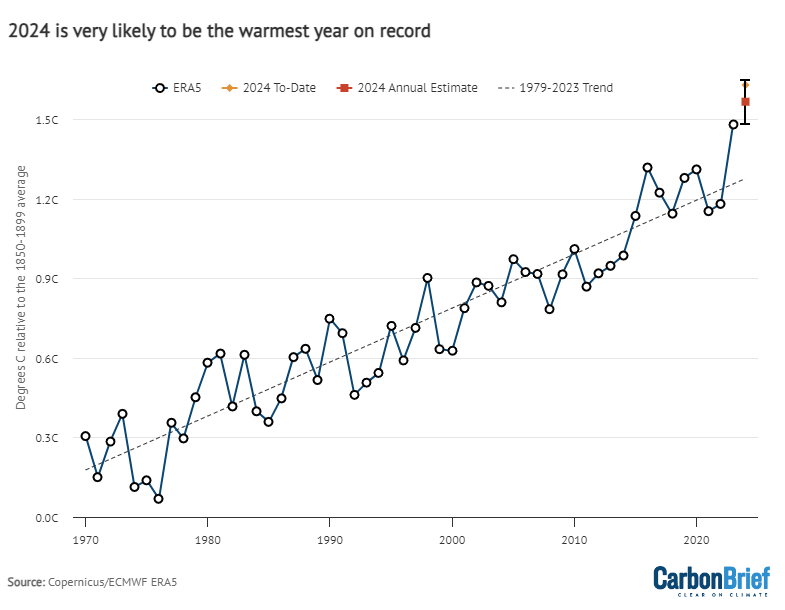
In this latest quarterly state of the climate assessment, Carbon Brief analyses records from five different research groups that report global surface temperature records: NASA, NOAA, Met Office Hadley Centre/UEA, Berkeley Earth and Copernicus/ECMWF.
The figure below shows the annual temperatures from each of these groups since 1970, along with the average over the first six months of 2024. (Note: at the time of writing, June data was not yet available for the Hadley/UEA record.)

The globe, as a whole, has warmed more than 1C since 1970, with strong agreement between different global temperature records. However, there are larger differences between temperature records further back in time (particularly pre-1900) due to sparser observations and a resulting greater sensitivity to how gaps between measurements are filled in.
All show that the average global temperature for 2024 so far is higher than any prior annual record. However, annual temperatures may end up being a bit lower than those of the first six months of the year, as El Niño conditions have faded and a mild La Niña event is likely to develop later in the year.
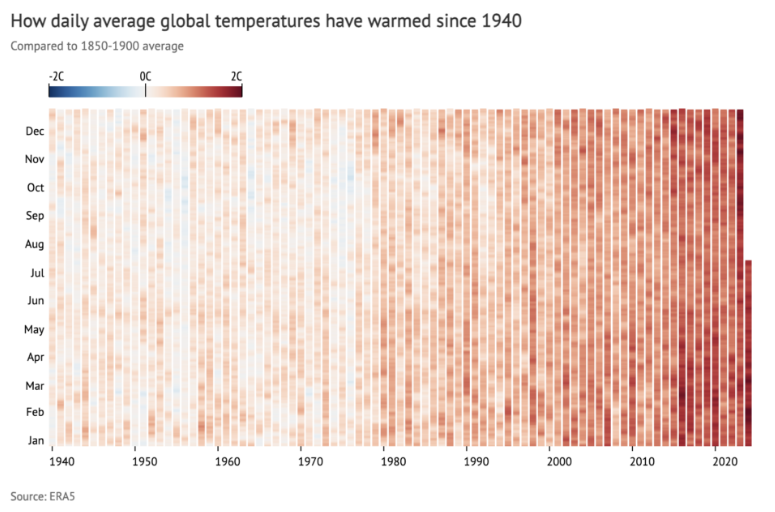
The last two years – 2023 and 2024 – stand out as substantially warmer than any prior year in the temperature record. The chart below shows a heat map of daily global average temperatures in the Copernicus/ECMWF ERA5 dataset, with temperatures shown by colours ranging from blue (-2C) to red (+2C), with the pre-industrial average (1850-1900) set to 0C. The figure below shows each day since 1940 in the dataset.
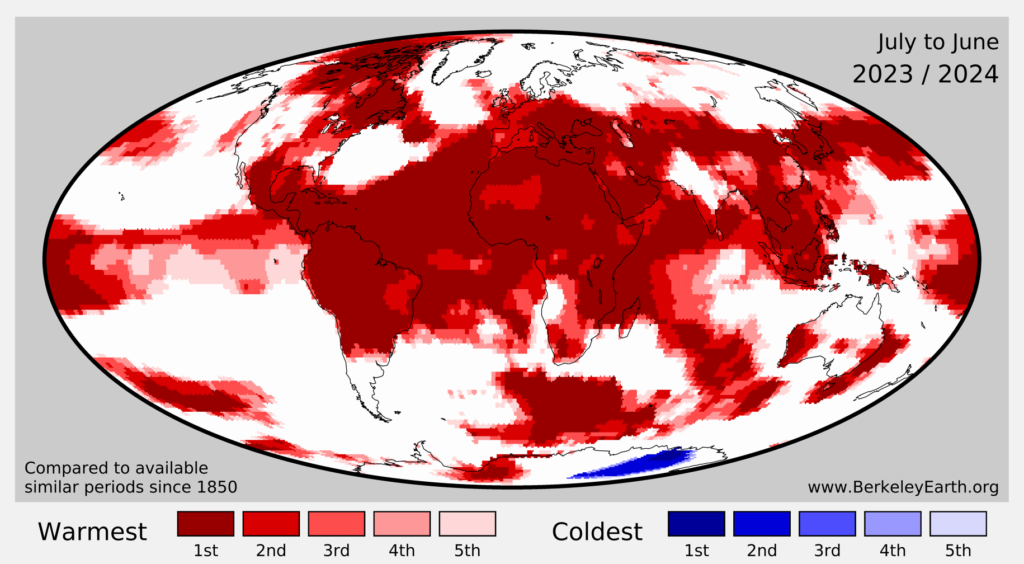
While global average surface temperature changes are an important indicator of long-term climate change, any month or year will have important regional warm or cool patterns in different parts of the world.
June 2024 saw particularly warm temperatures over much of South America, the southern US and Mexico, northern Africa, western Europe, central Asia and the Middle East among other regions.
The figure below shows the difference between temperatures in June 2024 and the baseline period of 1951-80, taken from Berkeley Earth (using their high-resolution temperature dataset). Red, orange and yellow shading indicate areas that have been warmer than average, while blue shows areas that have been cooler.

In total, 63 countries, mostly in Africa and South America, had their warmest national-average June on record. These included Brazil, Bulgaria, Cambodia, Colombia, Egypt, Ethiopia, Ghana, Greece, Israel, Ivory Coast, Jordan, Kenya, Lebanon, Libya, Nepal, Romania, Saudi Arabia, Somalia, South Africa, South Korea, Sudan, Syria, Turkey, Venezuela and Yemen.
The figure below shows which portions of the Earth’s surface experienced record high temperatures (deep red shading) in June 2024. It is noteworthy that almost no location on the planet experienced record cold temperatures.
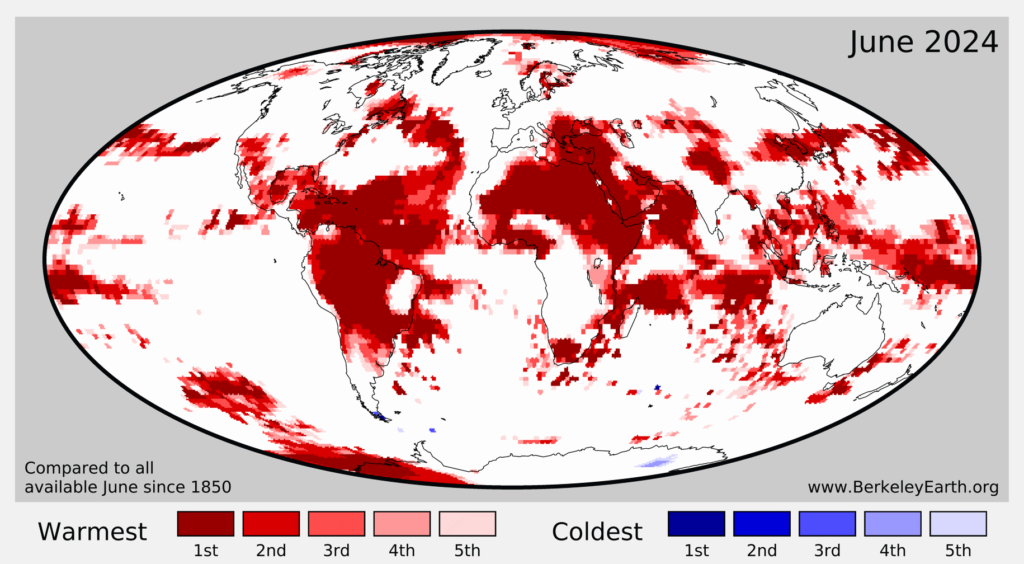
Zooming out to the past 12 months (July 2023 to June 2024), 138 countries saw all-time records broken. This includes much of Central and South America, Canada, Africa, Europe, China, the Middle East and south-east Asia. Only an anomalous patch of east Antarctica saw record cold temperatures.
With half the year of data now available, Carbon Brief has determined that there is now an approximately 95% chance that 2024 will beat 2023 and be the warmest year on record, based on Copernicus/ECMWF’s ERA5 dataset. (Berkeley Earth separately estimated a 92% chance in their June update.)
By looking at the relationship between the first six months and the annual temperatures for every year since 1970 – as well as El Niño-Southern Oscillation conditions for the first six months of the year and projections for the remaining nine months – Carbon Brief has created a projection of what the final global average temperature for 2024 will likely turn out to be.
The analysis includes the estimated uncertainty in 2024 outcomes, given that temperatures from only the first half of the year are available so far.
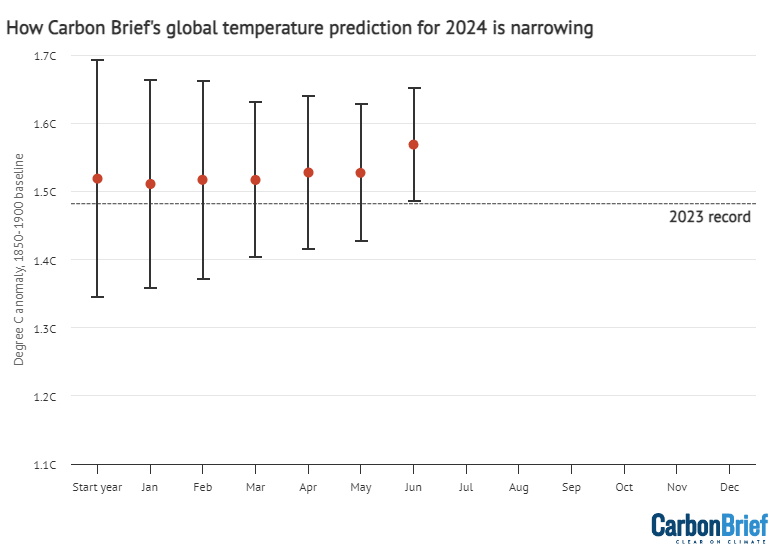
The chart below shows the expected range of 2024 temperatures using the Copernicus/ECMWF global atmospheric reanalysis product (ERA5) – including a best-estimate (red) and year-to-date value (yellow). Temperatures are shown with respect to the pre-industrial baseline period (1850-1900).
Carbon Brief’s projection suggests that 2024 is very likely to be the warmest year on record, with a central estimate of 1.57C.
This is true even if – as the projection implicitly assumes – the remaining months in 2024 are below the records set in 2023. Because the first six months of the year were so warm – around 1.63C above pre-industrial levels – the second half of the year would have to be relatively cool (below 1.3C) for the year as a whole to not exceed 2023.
It is worth repeating that an individual year hitting 1.5C above pre-industrial levels is not equivalent to the 1.5C limit within the Paris Agreement. This limit refers to long-term warming, rather than an individual year that includes the short-term influence of natural fluctuations in the climate, such as El Niño. Even including data through to the present day, long-term global temperatures (excluding year-to-year variability) are unlikely to exceed 1.5C until the late 2020s or early 2030s.
The figure below shows Carbon Brief’s estimate of 2024 temperatures using ERA5, both at the beginning of the year and once each month’s data has come in. The central estimate remained relatively unchanged until June, after which it increased a bit as the month turned out a bit warmer than the model anticipated. The uncertainty has diminished with each additional month of data, as there are fewer remaining months in 2024 to substantially change the results.
There is reason to expect that global temperature anomalies will modestly decline over the remainder of the year as El Niño fades away and moderate La Niña conditions potentially develop. The figure below shows a range of different forecast models for ENSO for the rest of this year, produced by different scientific groups. The values shown are sea surface temperature variations in the tropical Pacific – the El Niño 3.4 region – for overlapping three-month periods.
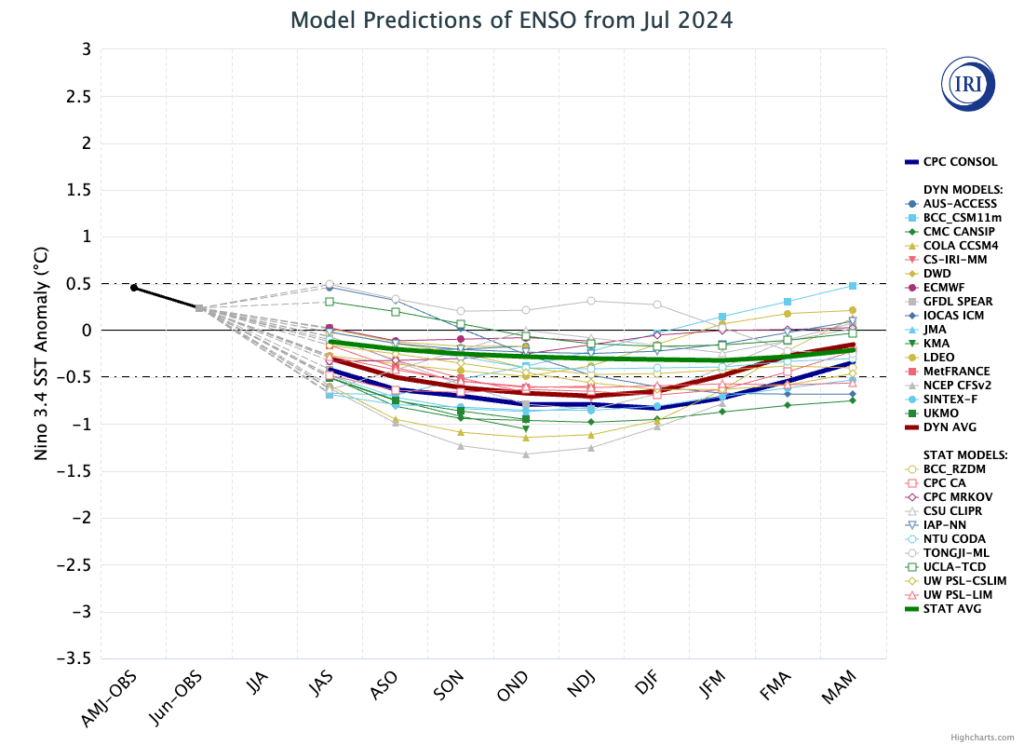
There is a mix of projections across models, with many of the dynamical models expecting very modest La Niña conditions (<-0.5C Niño 3.4 sea surface temperature – SST – anomaly) to develop by October, while most of the statistical models expect ENSO-neutral conditions to persist.
Global surface temperatures have set a 13-month streak of monthly records from June 2023 and June 2024. However, with more than two thirds of July temperature now available, it is looking increasingly likely that July 2024 will break that streak, coming in as the second warmest on record after July 2023.
The figure below shows daily temperature anomalies from the Copernicus/ECMWF ERA5 record for 2024 (purple line), 2023 (red line) and 1940-2022 (grey lines). It highlights that July 2024 has been at or below 2023 temperatures for all but the past few days.
Current global temperature anomalies are back in record territory as of 22 July, at around 1.7C above pre-industrial levels.
This is still well below the anomalies of 2C or more briefly hit in late 2023 and early 2024. However, because the current temperature anomalies align with the warmest week of the year for global surface temperatures, they have resulted in a new record for absolute global temperatures. This is shown in the figure below, which features daily absolute global temperatures from the Copernicus/ECMWF ERA5.
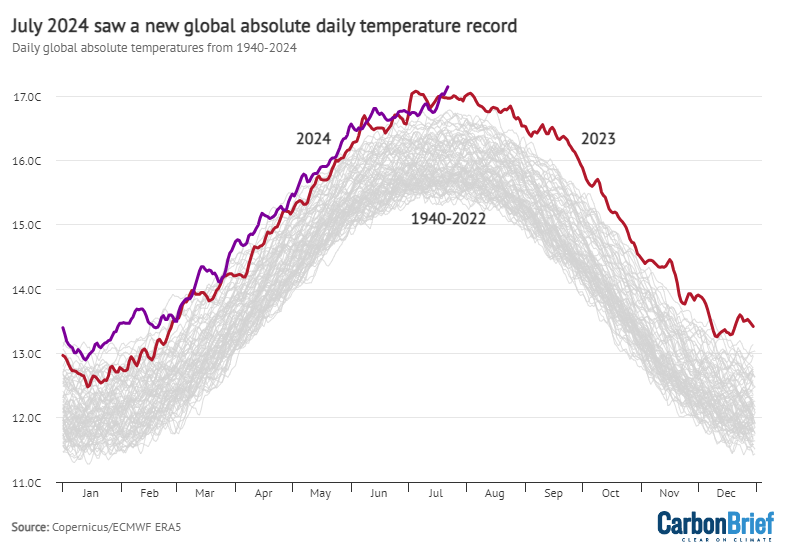
The prior daily absolute temperature record was 17.08C, set in early July 2023. This was exceeded both by 22 July (at 17.09C) and 22 July (at 17.15C).
While these daily absolute temperature records are not that climatically meaningful (and are only available in reanalysis data) – anomalies give a better sense of actual changes that are occurring – they nonetheless represent a symbolic milestone.
To determine where July 2024 temperatures will ultimately end up, Carbon Brief used a statistical model that extrapolates the final monthly temperatures based on the first 22 days of the month in all prior Julys since the ERA5 record began in 1940.
The figure below shows the expected range of July 2024 temperatures (black error bars) alongside a best-estimate (red diamond). Temperatures are shown with respect to the pre-industrial baseline period (1850-1900).
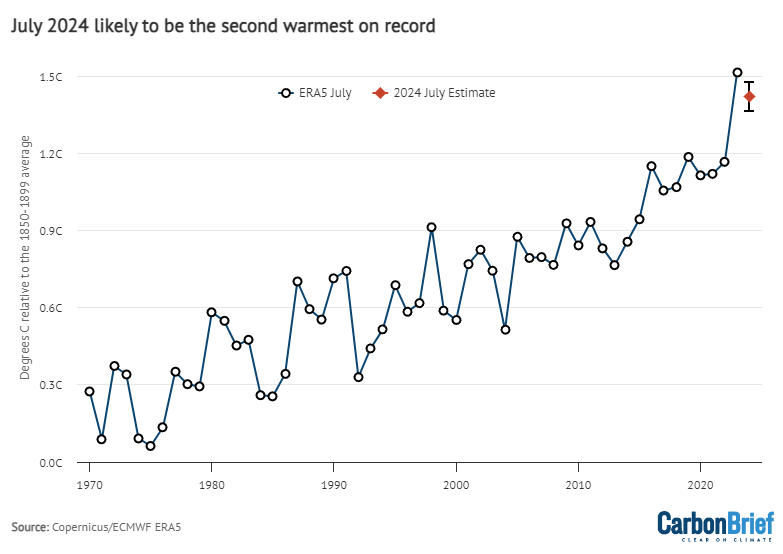
Here, Carbon Brief estimates that there is a very likely (>95%) chance that July 2024 comes in as the second-warmest July on record after 2023. However, it will still be quite warm, at more than 0.2C warmer than any July prior to 2023.
The extreme heat the world experienced in the latter half of 2023 makes setting new records over the remainder of the year less likely.
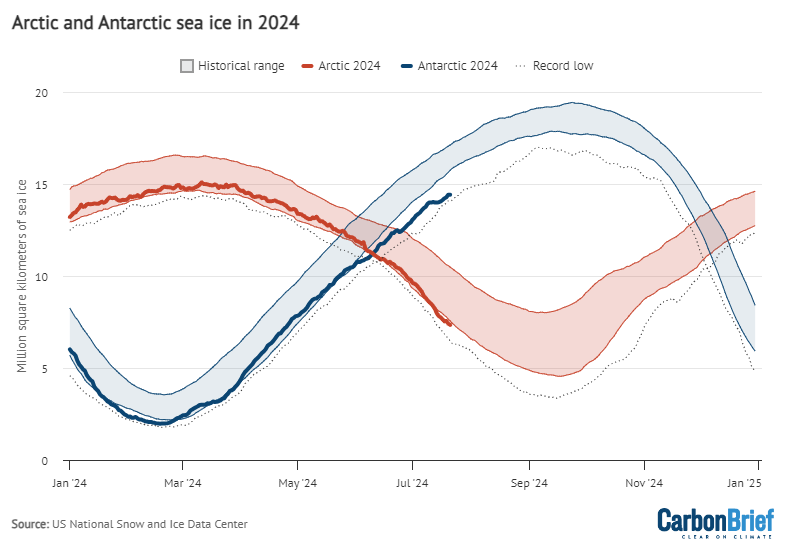
Antarctic sea ice extent spent much of early 2024 at the low end of the historical 1979-2010 range, though it has not quite exceeded record lows experienced in 2023.
However, in recent weeks Antarctic sea ice extent has rapidly dropped, and is now only modestly above 2023 levels.
Arctic sea ice extent has also spent most of this year at the low end of the historical range.
The figure below shows both Arctic and Antarctic sea ice extent in 2024 (solid red and blue lines), the historical range in the record between 1979 and 2010 (shaded areas) and the record lows (dotted black line). Unlike global temperature records (which only report monthly averages), sea ice data is collected and updated on a daily basis, allowing sea ice extent to be viewed up to the present.
Burning all the oil and gas from new discoveries and newly approved projects since 2021 would emit at least 14.1bn tonnes of carbon dioxide (GtCO2), according to Carbon Brief analysis of Global Energy Monitor (GEM) data.
This would be equivalent to more than an entire year’s worth of China’s emissions.
It includes 8GtCO2 from new oil and gas reserves discovered in 2022-23 and another 6GtCO2 from projects that were approved for development over the same period.
These have all gone ahead since the International Energy Agency (IEA) concluded, in 2021, that “no new oil and gas fields” would be required if the world were to limit global warming to 1.5C .
Since then, world leaders gathering at the COP28 summit at the end of 2023 have also agreed to “transition away from fossil fuels”.
Despite this, nations such as Guyana and Namibia are emerging as entirely new hotspots for oil and gas development. At the same time, major historic fossil-fuel producers, such as the US and Iran, are still going ahead with large new projects.
Additionally, oil majors such as TotalEnergies and Shell that have made public commitments to climate action, are among the biggest players investing in new oil and gas extraction around the world.
In 2021, the IEA issued its first “net-zero roadmap”, setting out a pathway for the world to limit warming to 1.5C. The influential agency concluded that:
“Beyond projects already committed as of 2021, there are no new oil-and-gas fields approved for development in our pathway.”
This statement has become a rallying cry for campaigners and leaders pushing for a phase out of fossil fuels.
The IEA has since clarified that there would be no need for new oil and gas developments if the world gets on track for 1.5C. It has also slightly softened its language, by allowing for new oil and gas projects with a “short-lead time” within its 1.5C scenario.
Yet it has also warned of the risk of “overinvestment” in new developments, noting that current spending is “almost double” what would be needed under its 1.5C pathway.
In any case, the IEA’s message has been widely ignored by oil and gas companies, which have continued to search for new extraction opportunities.
In its new global oil and gas extraction tracker, GEM identifies 50 new sites discovered in 2022 and 2023, after the IEA issued its initial net-zero roadmap. The oil and gas reserves from these projects amount to 20.3m barrels of oil equivalent (Mboe).
The tracker also identified a further 45 projects that have reached “final investment decision” (FID) since the IEA’s roadmap, with an extra 16Mboe of reserves. FID is the point at which companies decide to move ahead with a project’s construction and development.
If all the oil and gas in the newly discovered reserves is burned in the coming years, an extra 8GtCO2 would be released into the atmosphere, according to Carbon Brief analysis. Adding the reserves discovered between 2022-23 brings this total to 14.1GtCO2.
This is equivalent to more than one-third of the CO2 emissions from global energy use in 2022, or all the emissions from burning oil that year, as shown in the chart below.

These findings are in line with mounting evidence that both company and government plans for fossil fuels are not aligned with their own climate goals.
According to the most recent UN Environment Programme “production gap” report, companies are planning for gas and oil production that is 82% and 29% higher, respectively, than would be needed in a 1.5C pathway.
The remaining “carbon budget” of emissions that can be released while retaining a 50% chance of limiting warming to 1.5C is just 275GtCO2, according to the Global Carbon Budget consortium of scientists. Burning all of the contents of the new oil and gas schemes identified by GEM would use up 5% of this remaining budget.
Moreover, the GEM report points out that new projects take, on average, 11 years to start producing significant amounts of oil and gas. This means that most will not enter production until the 2030s.
By this point, according to the IEA, fossil-fuel demand would have fallen by “more than 25%” if the world gets on to a 1.5C-compliant pathway.
GEM also notes that its analysis likely underestimates the scale of new fossil fuel developments. It excludes smaller sites and those where the size has not been publicly announced, such as new gas fields discovered in Saudi Arabia in 2022.
The IEA updated its net-zero scenario in 2023 to reflect the continued expansion of fossil-fuel projects since its previous report. It stated that:
“No new long lead time conventional oil and gas projects need to be approved for development.”
It added that falling demand for fossil fuels “may also mean that a number of high cost projects come to an end before they reach the end of their technical lifetimes”, again if the world gets onto a 1.5C pathway.
To reflect the IEA’s new language around avoiding “long lead time” and “conventional” projects, GEM excludes expansions of existing projects and “unconventional” sites from its analysis. The report notes that including them would roughly quadruple the size of the reserves that reached a FID in 2022-23.
Many oil companies have made it clear that they do not intend to wind down their fossil-fuel operations in the near future.
This is true even for those that have made commitments to climate action, such as Shell and TotalEnergies. (Some oil majors have also watered down their pledges in recent months.)
As the chart below shows, many of the companies with the largest share of new oil and gas schemes have also announced net-zero targets.
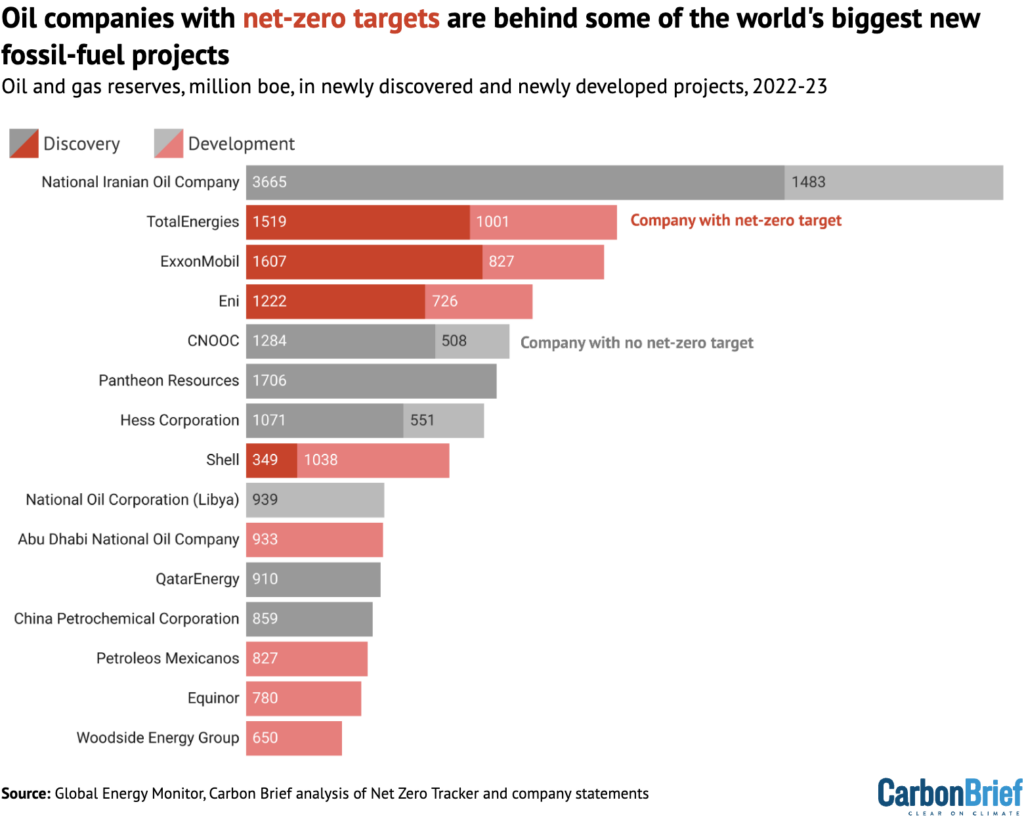
The top rankings are dominated by publicly traded oil majors, such as ExxonMobil, and national companies, such as the Abu Dhabi National Oil Company (ADNOC) – which is led by COP28 president Sultan Al Jaber. Saudi Aramco, the world’s largest oil company, is missing from the GEM tracker, likely due to the lack of data from Saudi Arabia.
The emissions that could result from new gas fields run by the state-owned National Iranian Oil Company alone amount to 1,700MtCO2, according to Carbon Brief analysis. This is higher than the annual carbon footprint of Brazil.
Meanwhile, oil and gas in new projects being developed by TotalEnergies and ExxonMobil could generate roughly 1,000MtCO2 – equivalent to Japan’s annual total – for each company.
At the recent CERAWeek industry conference, many oil and gas industry leaders argued against a transition to cleaner forms of energy. For example, Saudi Aramco chief executive Amin Nasser told attendees: “We should abandon the fantasy of phasing out oil and gas.”
As companies continue searching for more oil and gas, executives have consistently emphasised that demand for fossil fuels, rather than production, is the problem.
Most recently, in an interview with Fortune, ExxonMobil chief executive Darren Woods placed the blame on the public, who he said “aren’t willing to spend the money” on low-carbon alternatives.
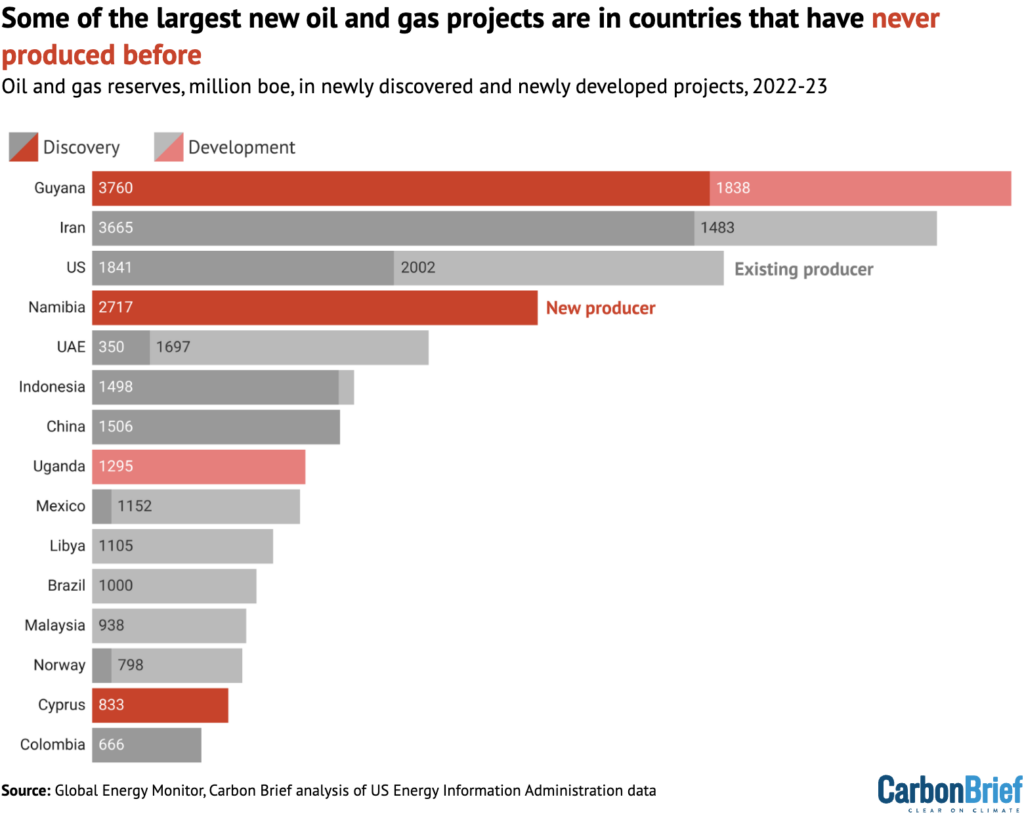
New nations, mainly in the global south, are opening up as “global hotspots” for oil and gas projects, according to GEM.
Notably, Guyana is set to have the highest oil production growth through to 2035. Over the past two years, it has already been the site of more new oil and gas discoveries than any other country. Namibia has also opened up as a major new frontier in fossil-fuel extraction.
The chart below shows how nations that have recently been targeted for oil and gas exploration, now make up a large portion of new discoveries and developments.
The expansion of oil and gas production in the global south is a highly politicised topic.
Many African leaders, in particular, argue that their countries are entitled to exploit their natural resources in order to bring benefits to their people, as global-north countries have done. At COP28, African Group chair Collins Nzovu stated that oil and gas were “crucial for Africa’s development”.
(It is worth noting that, according to GEM’s analysis, companies based in the global north such as ExxonMobil, Hess Corporation and TotalEnergies own most of the reserves in the new global-south projects.)
Meanwhile, wealthy oil producers such as the US, Norway and the UAE justify their continued fossil-fuel extraction by saying their production emissions are relatively low. Others, such as the UK, argue that they need to exploit domestic reserves to preserve their energy security.
Even in a 1.5C scenario, the IEA still includes a significantly reduced amount of oil and gas use in 2050. Most of it goes towards making petrochemicals and producing hydrogen fuel.
However, in last year’s report on the position of the oil and gas industry in the net-zero transition, the agency also emphasises that this does not mean everyone can continue producing.
“Many producers say they will be the ones to keep producing throughout transitions and beyond. They cannot all be right,” it concludes.
EQUITY: Nearly half of Americans live in states that don’t bar electricity shutoffs during heatwaves, putting 45 million low-income Americans at risk of being unable to cool their homes when heat turns deadly. (The Guardian)
POLITICS:
GRID:
OIL & GAS:
WIND:
SOLAR:
ELECTRIC VEHICLES:
COMMENTARY: Two energy justice researchers warn the U.S. is experiencing an electricity disconnection crisis as utilities are allowed to shut off power to residents who can’t pay their bills even in deadly heat. (The Conversation)
OIL & GAS: Native Alaska communities sue the Biden administration over its oil and gas drilling ban on 10.6 million acres in a national petroleum reserve, saying it violates federal laws. (Bloomberg Law)
CLIMATE:
ELECTRIFICATION: A fossil fuel trade group plans to file a lawsuit seeking to block Denver, Colorado’s building codes restricting natural gas appliances in commercial and multifamily buildings. (CPR)
BATTERIES:
SOLAR:
EFFICIENCY: The U.S. Energy Department awards California and Utah a total of $7.3 million to advance building decarbonization and other efficiency-oriented programs. (news release)
GRID: Federal regulators approve incentives for Southern California Edison’s proposed transmission projects aimed at reducing congestion and increasing access to utility-scale solar. (RTO Insider, subscription)
UTILITIES:
URANIUM:
CLEAN ENERGY: Observers expect an upcoming Hawaii energy strategy to suggest using liquefied natural gas generation as a bridge to help the state reach its 100% renewable energy goal. (Honolulu Civil Beat)
COMMENTARY: After visiting a New Mexico oil and gas drilling site, an author and advocate concludes the “fossil fuel industry chases short-term profit and leaves long-term wreckage in its wake.”(Guardian)

.svg)
