

U.S. Steel says it will invest $1.9 billion to build a modern and lower-carbon ironmaking plant in Arkansas — marking a key expansion beyond the company’s coal-based steel mills.
The new “direct reduced iron” plant will sit alongside the sprawling Big River Steel Works, in the town of Osceola, where four electric arc furnaces melt down scrap metal with iron to make high-quality steel for vehicles and electrical equipment. Put together, the forthcoming ironmaking plant and the existing furnaces represent an emerging model for cleaner steelmaking.

Finished iron ore pellets at U.S. Steel’s Minnesota Ore Operations (U.S. Steel)
U.S. Steel, which is owned by Japan’s Nippon Steel, announced the project on Wednesday. The parent company has committed to investing $11 billion in the U.S. by 2028 to expand its lower-emissions production as well as to extend the lives of aging blast furnaces in places like Gary, Indiana.
Blast furnaces use coal and extreme heat to transform raw iron ore into molten iron, and the process is responsible for most of the planet-warming emissions and toxic air pollution associated with the industry. The iron then flows into a neighboring furnace to be processed into sturdy steel.
Direct reduction plants, by contrast, primarily use natural gas to turn iron ore into lumps of iron. These facilities can emit about half the CO2 emissions of coal-based blast furnaces. A handful of efforts are underway globally to instead use green hydrogen, which is made with renewable energy, to produce nearly zero-emission iron.
In the United States, three gas-fueled DRI plants are already operating: in Louisiana, Ohio, and Texas. The iron they make helps strengthen and improve the quality of recycled steel. But none of those facilities is sited next to any of the nation’s 150-odd electric arc furnaces, meaning the iron must be cooled, transported, and eventually reheated.
U.S. Steel’s new DRI facility in Arkansas will be the first in the country with the ability to “hot charge” iron directly into the steel furnace while it’s still at high temperatures, a spokesperson for the manufacturer told Canary Media by email. That will allow the facilities to operate in a way similar to traditional integrated steel mills, where iron- and steelmaking happen at the same site.
“This increases efficiency and reduces electricity needs,” the spokesperson said.

An illustration of U.S. Steel’s planned DRI facility at Big River Steel Works, in Osceola, Arkansas (U.S. Steel)
The ironmaking plant will use natural gas, the company confirmed, and it will source iron ore pellets from U.S. Steel’s mine in Minnesota. Construction on the DRI facility is expected to happen across the next 30 months, with startup slated for the first half of 2029.
“Our partnership with Nippon Steel helped accelerate this investment years sooner than would have otherwise been possible,” David Burritt, president and CEO of U.S. Steel, said in a Wednesday press release.
For some green steel advocates, Nippon Steel’s 2025 acquisition of U.S. Steel represents a key opportunity to not only invest in new projects but also modernize and decarbonize its legacy operations in Illinois, Indiana, Michigan, and Pennsylvania. Steel jobs in those states have dramatically declined in recent decades as American steelmakers lost out to overseas suppliers, and as fierce competition emerged at home from steel-recycling mills in primarily Southern states.
In fact, the Arkansas expansion may accelerate that downward trend. New iron made there could potentially replace some of the metal that Big River Steel’s electric arc furnaces currently source from the Gary Works mill in Indiana, said Roger Smith, who follows Nippon Steel and U.S. Steel closely as the Asia lead for the nonprofit SteelWatch. He added that the companies have also announced plans to build a major new plant with electric arc furnaces somewhere in the United States.
“But when it gets to the rest of the legacy facilities, the things they’ve talked about to date are really largely in the category of maintenance,” Smith said during a recent green-steel panel in Chicago. At Gary Works, Nippon Steel has committed to spending around $300 million to revamp the largest of its four blast furnaces this year and another $200 million to refurbish a hot-strip mill.
Local advocates are pushing for the company to go further. Jack Weinberg, a member of Gary Advocates for Responsible Development and a former steelworker, said that replacing Midwestern blast furnaces with DRI facilities would offer a path forward for historic steel communities. That could include initially building gas-fueled ironmaking plants that later switch to using green hydrogen as supplies become available.
“We’re advocating for a transition where they don’t have to shut down the mill,” he said during the panel.
This article originally appeared on Inside Climate News, a nonprofit, non-partisan news organization that covers climate, energy and the environment. Sign up for their newsletter here.
Reporting for this story was supported by a grant from the Fund for Investigative Journalism.
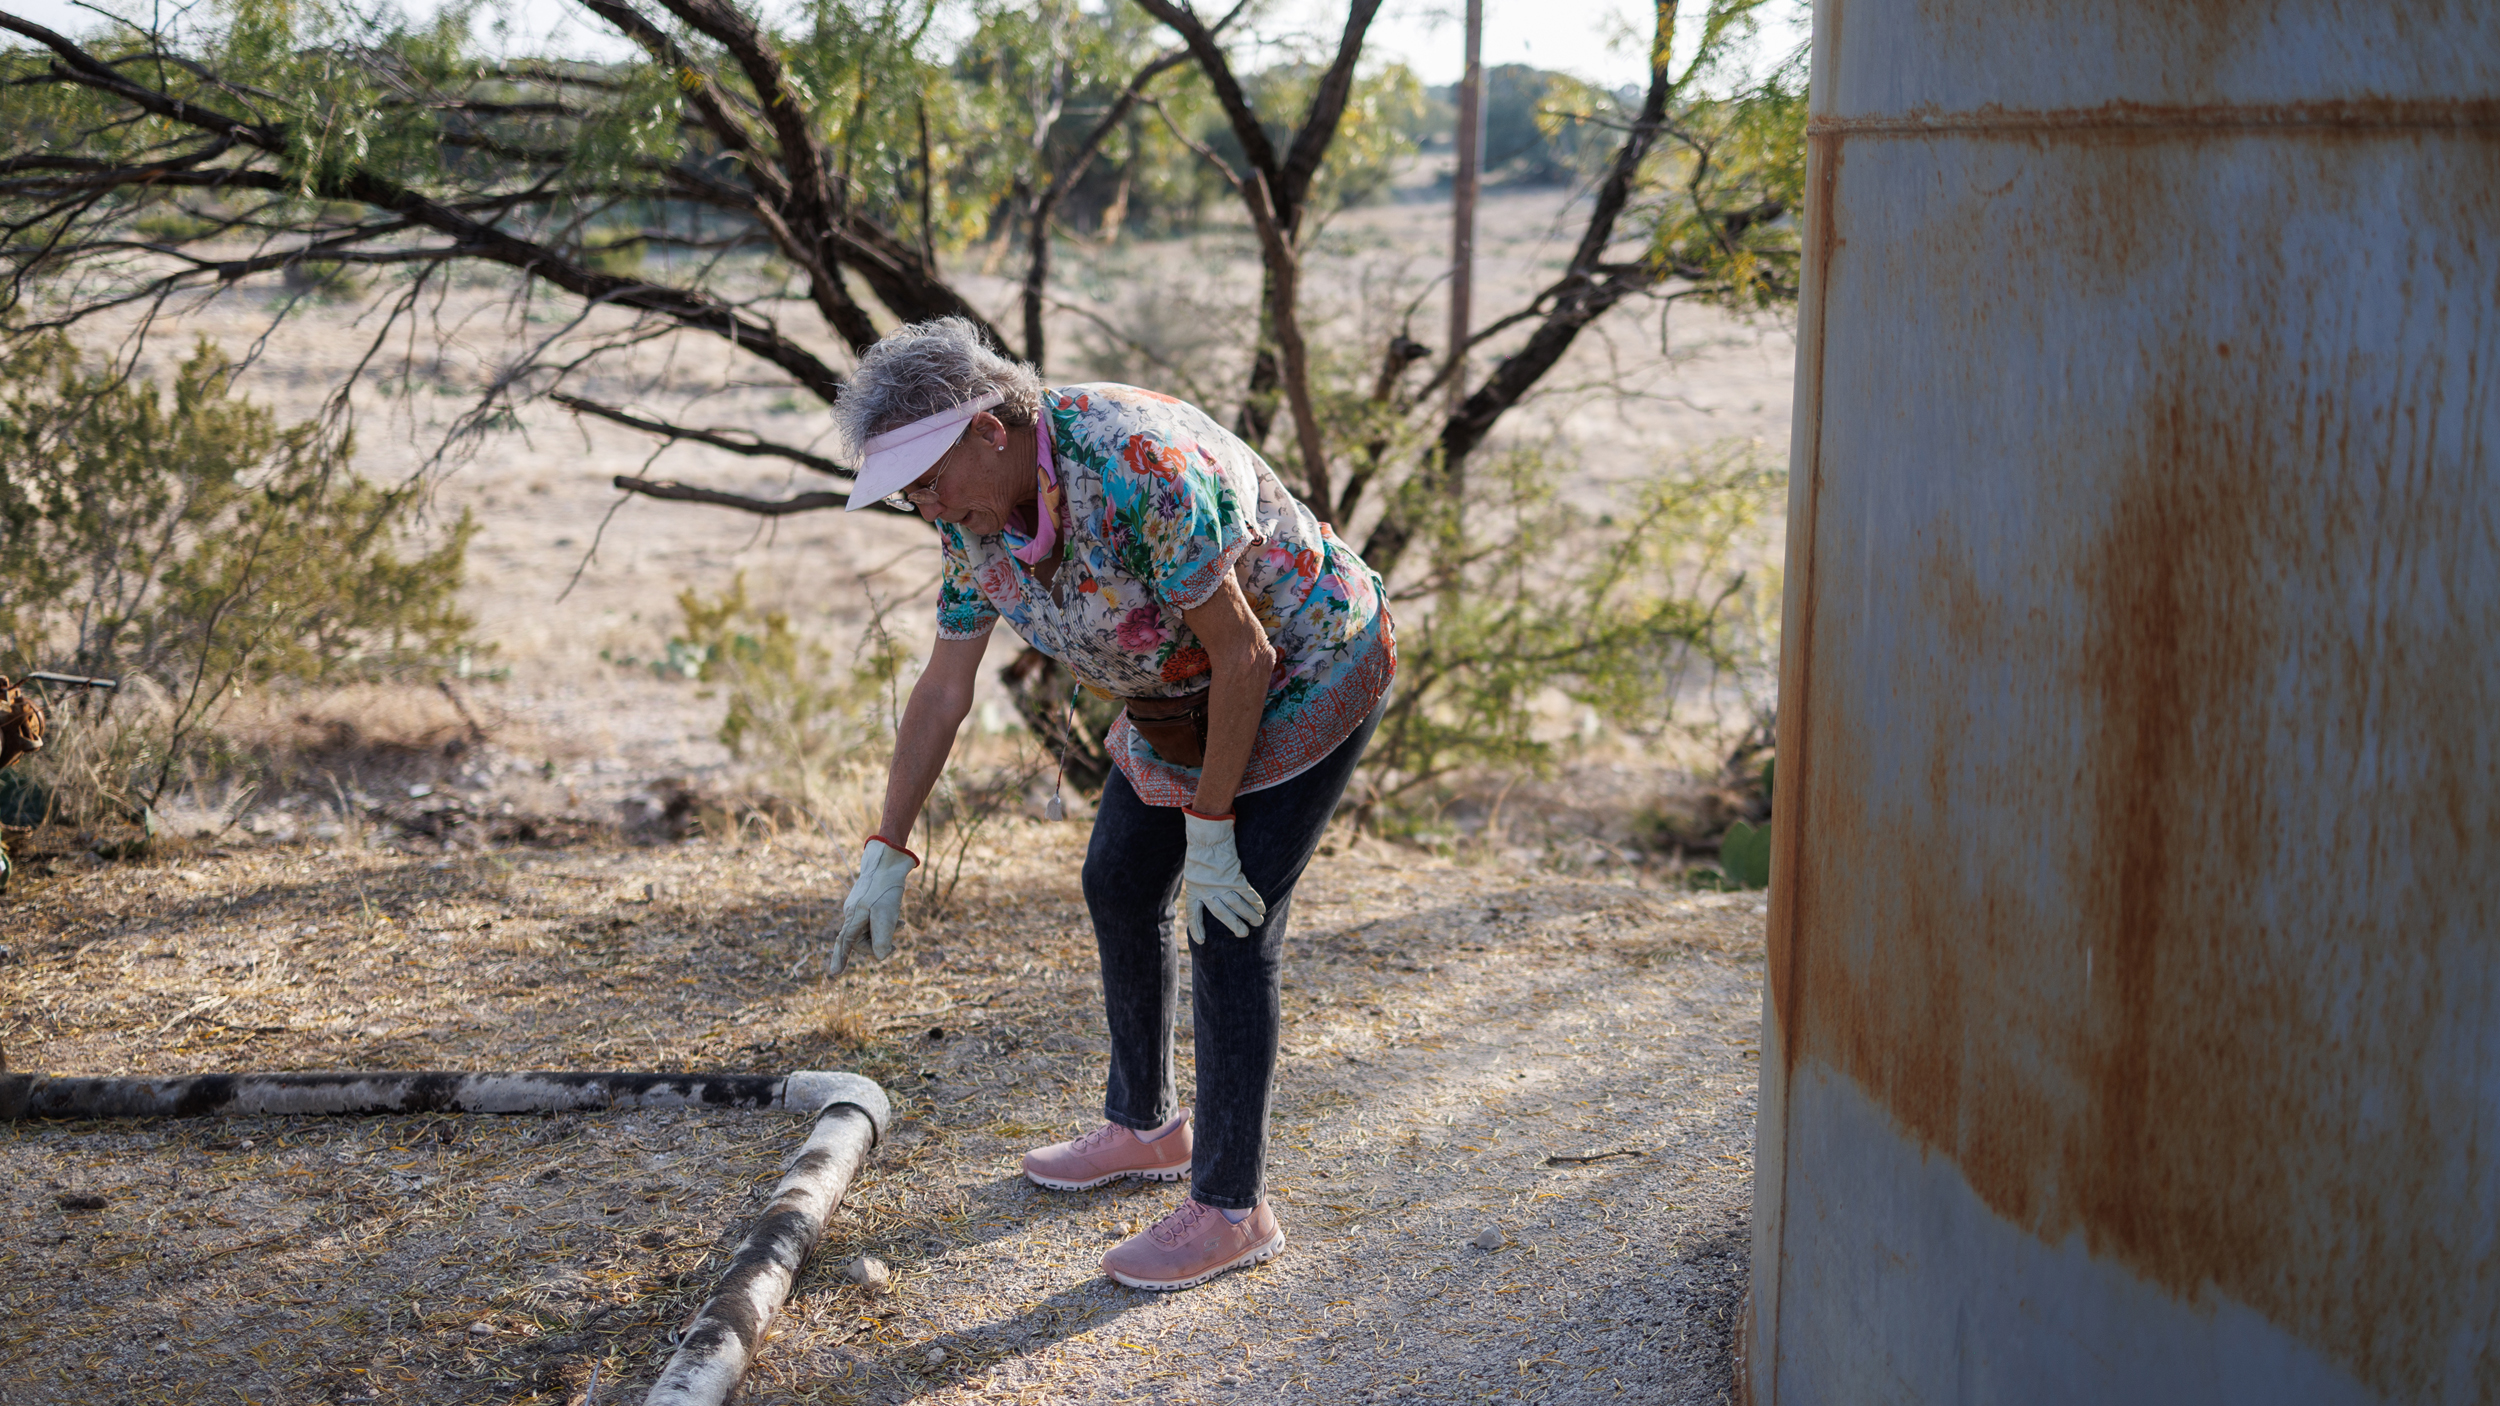
TOM GREEN COUNTY, Texas—Some Texas oil wells gush hundreds of barrels of oil a day. But many are like the wells on Jackie Chesnutt’s ranch in West Texas that only trickle out a couple barrels a month.
Chesnutt, a retired engineer, claims the five wells operating on her ranch are out of compliance with state rules and should be shut down. The company, CORE Petro, says that it’s struggling to break even, let alone pay to plug the wells. But it says that all its wells are in compliance.
There are thousands of oil and gas wells around Texas like these: low-producing wells leased by companies operating on a shoestring. About two-thirds of the active oil wells in Texas, or 99,000 wells, produce less than 10 barrels of oil a day, according to the state regulator. To remain active, oil wells in Texas must produce at least five barrels for three consecutive months or at least one barrel for 12 consecutive months.

Jackie Chesnutt props up a sign next to a leaking oil well operated by CORE Petro on her property near Knickerbocker, Texas, on Nov. 18, 2025.
Companies will often maintain a minimal amount of oil production instead of plugging a well, which can cost tens of thousands of dollars. Landowners like Chesnutt argue that this pattern can lead to pollution and burdensome equipment on their land.
Oil industry analysts and environmental advocates say they have heard claims that companies report the bare minimum of oil production to avoid plugging wells.
“The wells on the lease are all producing,” said Railroad Commission spokesperson Bryce Dubee.
Advocates of reforming the oil and gas industry say that stricter rules are needed to ensure companies plug wells in a timely manner and assume the costs so that it does not fall to the state.

In a 2022 report on Texas’ orphan well problem, the nonprofit organization Commission Shift wrote companies should not be able to “indefinitely ‘produce’ a teaspoon of crude or a cubic foot of gas simply to avoid paying for decommissioning.”
Texas has more than 159,000 inactive wells. If the operator of an inactive well goes out of business, the unplugged well eventually becomes an orphan. Texas is facing a record-high backlog of more than 11,000 orphan wells.
Chesnutt is the rare landowner who is fighting back against this broken system. The 69-year-old and her now-deceased husband bought the 375-acre property outside San Angelo in 1998. After retiring from a career working at a pharmaceutical company in San Angelo, she now tends goats and sheep on the ranch.
Her complaints to the Railroad Commission, which regulates oil and gas, have gone nowhere, she said. She has resorted to shutting off power to CORE Petro’s wells because she says they are out of compliance with state production rules. CORE Petro responds that it’s Chesnutt who is breaking the law by shutting off power and, without electricity, they have no way to produce oil at the wells.
“We’re between a rock and hard place,” said Cassie Ohlhausen, who runs CORE Petro with her husband, Kent. “We’re not financially able to plug a bunch of oil wells. That’s not why we’re in this business. We’re in this business to produce oil wells.”

Chesnutt’s growing frustration has spilled over into confrontations with CORE Petro and commission staff. The Railroad Commission alleges that Chesnutt physically assaulted staff members and endangered them with aggressive driving. The agency has instructed her to put all communications in writing to avoid future incidents. The owners of CORE Petro say she has threatened them with a gun. Chesnutt disputes these claims.
The Railroad Commission declined to answer numerous questions about the oil lease on Chesnutt’s ranch. Instead, commission staff provided a letter sent to Chesnutt that described altercations with staff members. The Railroad Commission has not issued any fines to CORE Petro.
Chesnutt’s ranch is one small window into the vast problem of Texas’ aging oil assets. Existing financial mechanisms are not enough to retire the thousands of low-producing oil wells littered across the Texas countryside. The problem eventually falls to the state or becomes a thorn in the side of landowners like Chesnutt.
Persimmon Creek Ranch lays where the desert scrubland of the Trans Pecos region meets the rocky woodlands of the Texas Hill Country. The ranch, about 200 miles northwest of Austin, gets its name from the native persimmons she collects to make preserves.
“One of the biggest things we have focused on out here since we’ve bought the place is water, water, water,” she said. Chesnutt, now widowed, relies on a windmill-operated well to provide water for her residence and animals.
Chesnutt’s home office displays professional mementos, including her diploma from the University of Texas, Austin, where she was an early female graduate of the engineering program. She now applies an engineer’s attention to detail to investigating the drilling operations on her property.
Chesnutt holds 50 percent of the mineral rights on the property, meaning she receives a share of profits from the wells. This has amounted to only a few hundred dollars in royalties every couple months in recent years. This money is hardly worth the trouble the wells have caused, she said. She riffled through documents on a sunny fall afternoon, her dog Einstein asleep at her side.

While the lease was operated by a previous company, Amor Petroleum, Well #10 had been shut down for lack of production. That left only four producing wells.
Then CORE Petro took over the lease in 2021. Chesnutt says that is when the problems started.
Once a well is inactive, the operator has 12 months to plug it or obtain an extension. The clock started ticking for CORE Petrol to get Well #10 producing again. CORE Petro reported a small amount of production at the well to bring it back to active status.
Chesnutt said that the company caused numerous spills in their attempts to get oil flowing.
“They made a big mess of it,” she said, showing photos of spills of oil and produced water, a hazardous byproduct of drilling. Chesnutt fears the spills could contaminate her groundwater and has paid to get her water tested multiple times.
“We have worked our asses off to make this place wonderful and beautiful,” she said. “I refuse to accept that the next person is going to have this happen to them.”

The Railroad Commission issued CORE Petro multiple violations for unpermitted disposal of oil and gas waste, or spills, at the lease. But each time, the violation was later resolved without the company paying fines.
“RRC records indicate four pollution violations for this lease,” Railroad Commission spokesperson Dubee said. “In each instance the operator was notified and upon reinspection all violations have been fixed on the lease indicating compliance.”
CORE’s Ohlhausen said that some amount of spillage is to be expected and that the company always cleaned up the spills.
But Chesnutt’s frustrations only grew.
“What has really blown my mind about this is that we have to follow one set of rules in industry,” Chesnutt told Inside Climate News. ”But the oil companies, they allow them to just come out here and do whatever the hell they want.”
By her account, only one of the wells on her property has produced oil in years. But CORE Petro reports ongoing production at all the active wells. The Railroad Commission requires well testing to prove wells are producing oil. CORE Petro’s most recent well testing, in 2025, shows each well producing less than one barrel a day.
Chesnutt claimed the company is falsifying production numbers to keep the wells operating. The company denies this claim.
“The operators can fill in any information they want and nobody checks them,” she said. “It’s unacceptable. I’m really sad that the Permian Basin and all these areas are like this.”
Operators submit monthly reports to the Railroad Commission of how much oil is produced and how much is stored at each lease. While the state rules require every well to be actively producing oil, production reports are only required for the entire lease, not individual wells. Inside Climate News found inconsistencies between public records of oil production and inspections at the lease.
On July 2, 2025, a truck picked up oil from the ranch and recorded the level of oil in the tank afterward, according to a commission inspection report. A Railroad Commission inspector visited the site on Sept. 16. He noted that the amount of oil in the tank hadn’t changed since July 2.
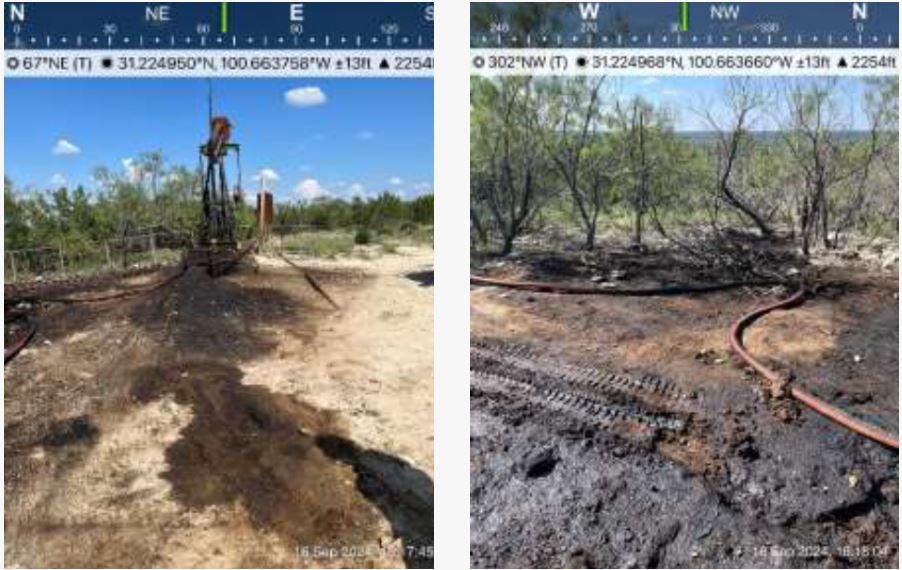
But in the intervening months, CORE reported producing 10 barrels in July and another 15 barrels in August. The company was reporting production on paper but the volume of the tank did not rise, according to the RRC inspection.
The Railroad Commission declined to answer questions about this and it does not appear the agency has investigated the discrepancy. Cassie Ohlhausen said that the company uses an auxiliary tank to collect the oil. Once it is full, the oil is transported to the tank battery, a large metal tank that stores oil. She said this could explain why the tank battery did not rise even though oil was being produced.
“The reporting of production is accurate and is done by a third party who tracks our oil sales and inputs those numbers into the RRC system,” Ohlhausen said.
Inside Climate News observed an auxiliary tank at only one well. Any oil produced at the other wells would have to flow directly into the tank battery.
Commission documents reveal other inconsistencies. On February 7, 2025, the Railroad Commission issued a violation to CORE Petro that said Well #9 was an “inactive unplugged well.” However, the next time the inspector visited the site, the well was determined to be compliant. The Railroad Commission declined to respond to questions about this.

Property owners have little recourse other than reporting the problems to the Railroad Commission. Chesnutt feels the Railroad Commission is ignoring her complaints about CORE Petro.
“Not one single acknowledgement that [the wells] should be plugged,” she said of her interactions with the state agency. “I’ve had resistance on even cleaning up the spills.”
Meanwhile, Chesnutt’s behavior has alarmed Railroad Commission staff. An attorney for the agency sent a letter to Chesnutt on Oct. 31, 2024. The letter states that she “verbally threatened and physically assaulted Commission staff” and “engaged in reckless and aggressive driving,” threatening the safety of commission staff. The letter also says that she told commission staff of her “intent to commit several violent crimes” against CORE Petro’s employees.
Chesnutt disputes the commission’s characterizations. “I don’t know, because I’ve never assaulted anyone,” she said.
The Tom Green County Sheriff’s Office has responded to calls from Chesnutt, Kent Ohlhausen and the Railroad Commission about incidents at the ranch, according to call sheets. The Railroad Commission requested the sheriff’s office be on “standby” when visiting Chesnutt’s property.
Commission inspectors have also noted in inspection reports that Chesnutt is turning off power to wells on her property. Chesnutt maintains that the wells pose a fire hazard and she is within her rights to turn them off. State rules require electricity be disconnected at inactive wells. Electrical lines for oil wells were blamed for starting devastating wildfires in the Texas Panhandle in 2024.


In response to the regulator’s claims of her “reckless driving,” Chesnutt said that last October she saw a Railroad Commission truck on the road leading to her ranch. She was driving in the opposite direction, so she did a U-turn and flashed her headlights to get the driver’s attention. She asked him to pull over and asked if he was headed to her property, because she was waiting for an inspector.
CORE’s Ohlhausen said that Chesnutt has threatened their staff multiple times.
“All the wells produce at some point or another until she goes and turns them off,” she said.
“We can’t afford a lawsuit, but we have every right to call the sheriff and the justice of the peace and have her stand down on turning our oil wells off,” she said.
CORE Petro specializes in operating aging, low-producing wells, Ohlhauser explains, noting that her husband Kent is called “the Oil Well Undertaker” because he works with “end of life wells.”
“We’re the ones that end up with what they call the stripper wells that have already been stripped of all their oil,” she said. “They’re just producing a bit of oil every day to keep somebody alive.”
Kent Ohlhausen owns several other oil companies. Many of the leases he operates meet the bare minimum requirement of one barrel of oil production a month for 12 consecutive months. For example, the Olhausen Oil Company’s Ohlhausen, W.T. lease reported one barrel of oil production for each month between April 2023 to April 2024. The same company’s Barker C.P. lease reported one barrel of oil production every month December 2023 to January 2025.
“We literally work seven days a week, producing stripper oils,” his wife said. “We just eke out a little bit of money and that’s just fine with us.”
The company paid a $50,000 bond to the state of Texas to cover plugging costs if they went out of business. But Ohlhausen said that, even if they wanted to, they wouldn’t be able to plug all their wells.
“Sometimes the money is not there,” she said. “We don’t take investors. We are just Kent and Cassie.”
Texas is dedicating more money than ever to plugging orphan wells. But the number of orphan wells continues to climb. Many of the marginal wells that continue producing when their owners do not have the means to plug them eventually become orphan wells.
“Operators will often produce a de minimis amount of hydrocarbons to stay out of inactive status,” said Adam Peltz, a senior attorney at the Environmental Defense Fund. ”This is widely abused.”
Peltz said that properly identifying inactive wells is important because it creates an “early warning system” for regulators.
“Every marginal well eventually becomes an inactive well. And many inactive wells become orphan wells,” he said. “There’s no reason why the public should bear the risk.”
New Mexico is in the process of reforming its bonding system for oil and gas wells. The proposed rule changes would classify wells that produce less than 90 barrels of oil a year as of “no beneficial use” and require them to be plugged.
Peltz said these changes would reduce the likelihood that the state would end up paying to plug the wells.
The Railroad Commission is also developing new rules for inactive wells following the passage of Senate Bill 1150 in 2025. The law requires plugging wells that are more than 25 years old and have been inactive for at least 15 years, unless they qualify for certain exemptions.
The Inflation Reduction Act created a $350 million fund for plugging marginal conventional wells to reduce methane emissions. The Texas Commission on Environmental Quality (TCEQ) received the largest grant from the program, of $134 million. The methane reduction program falls under the TCEQ, as the state agency that regulates air emissions from industry. The program is “currently in development” and staff are preparing to issue a request for grant applications to prioritize and select wells for plugging, according to a TCEQ spokesperson.
The program will rely on operators volunteering to plug their wells.
The program could help companies like CORE Petro plug wells that otherwise might end up orphaned.
“If there was a grant for us to plug wells, we’d be plugging wells all day,” Cassie Ohlhausen said. “Because we know that we own holes that are not gonna ever be viable.”

An aerial view of Jackie Lynn Chesnutt’s property in Tom Green County, Texas, on Nov. 18, 2025. She has owned the ranch for nearly three decades and worked to increase tree cover and provide wildlife habitat.
Examine fossil-fuel subsidies by country in USD. Visualise trends by fuel type and filter by beneficiaries and support mechanism for more detailed insights. To know more about these categories, go to Methodology. Global data in this visual might differ slightly from values displayed in the “Home” page. This is due to the methodology applied to disaggregate the data. For more information about this, visit the section “Data sources” in the Methodology.

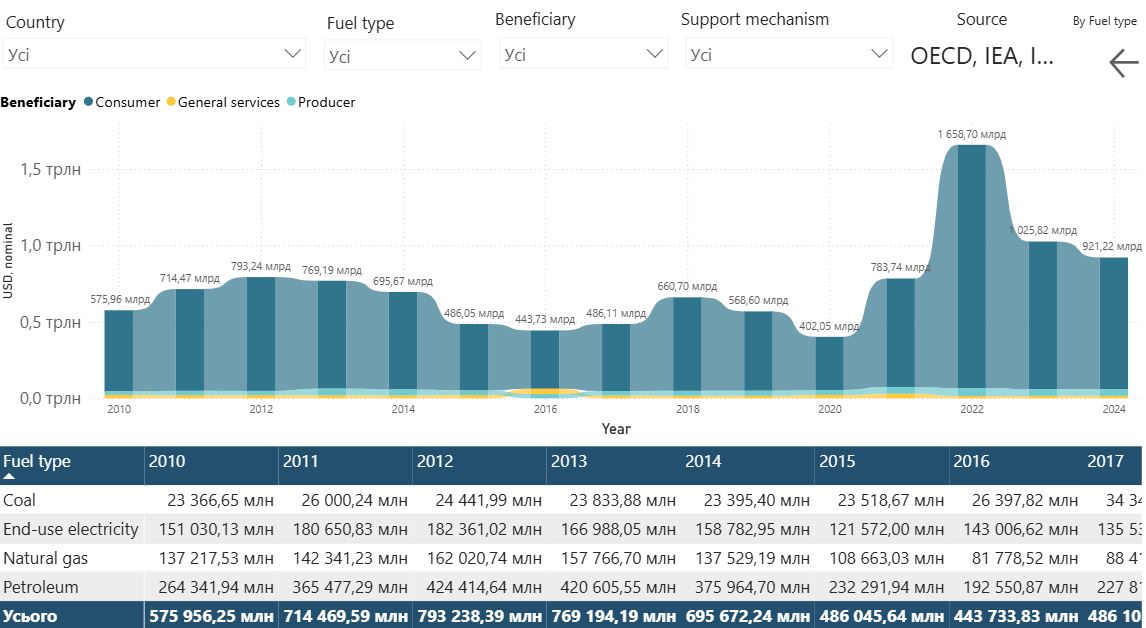
Disclaimer: Any data and any map included herein, are without prejudice to the status of or sovereignty over any territory, to the delimitation of international frontiers and boundaries and to the name of any territory, city or area. The dataset for 2023 is available for 83 economies.
Canary Media’s “Eating the Earth” column explores the connections between the food we eat and the climate we live in.
In late March, President Donald Trump dramatically expanded the federal mandates for farm-grown biofuels in cars, trucks, and tractors. In front of a cheering crowd that he called “the single largest gathering of farmers the White House has ever seen,” Trump announced his Environmental Protection Agency will require record amounts of soy-based biodiesel and corn-based ethanol to be blended into petroleum-based diesel and gasoline.
Like most of Trump’s environmental policies, and almost all biofuels policies, it’s terrible — for consumers, the climate, the hungry, and the country.
By diverting food crops into fuel and inflating demand for grain and vegetable oil, Trump’s jacked-up mandates will increase food prices, food shortages, and food insecurity. They’ll also accelerate deforestation and greenhouse gas emissions, inducing the world’s farmers to clear tens of millions of acres of new fields to exploit the higher prices for their crops. At the same time, they’ll inflate demand for fertilizer that’s already in short supply because of the Iran war, further increasing global food prices as well as corn-country pollution.
This is all bad. It’s morally unconscionable to reroute crops from bellies to cars when the grain it takes to fill the average gas tank could feed one of the world’s 150 million undernourished children for a month. It’s environmentally and economically nutty to use good farmland to grow ethanol when an acre of solar panels produces 20 to 100 times more energy than an acre of corn. The world is on track to deforest a land mass nearly twice the size of India for agriculture by 2050, and biofuels are a remarkably inefficient use of increasingly scarce soil.
But as I wrote in this space four years ago when President Joe Biden was promoting biofuels during a global food crisis, the badness is bipartisan; few Democrats oppose aggressive government support for farm-grown fuels. The badness is global, too; Brazil, Canada, India, Indonesia, and other nations are ratcheting up incentives for crop-based fuels for cars and trucks. There’s also a growing worldwide effort to run planes on farm-grown “sustainable aviation fuel,” including generous subsidies in the One Big Beautiful Bill Act that Trump signed last year.
Really, the only unique aspect of the biofuel badness at Trump’s White House “Celebration of Agriculture” was his candor about its purpose: to shovel cash to farmers, his most loyal voting bloc and America’s most powerful lobbying force.
He didn’t really pretend he was trying to give consumers relief from exorbitant gas prices or reduce America’s dependence on foreign oil, the industry’s current arguments for stuffing more crops into fuel tanks. He certainly didn’t pretend he was trying to help the planet; in fact, he exulted about all the regulatory “environmental nonsense” he’s gutted to save farmers money. He didn’t even pretend he was simply trying to ensure farmers a level playing field; he boasted about all the special treatment he’s given them, including “massive new loan guarantees,” a huge bailout to offset his tariffs —“I just gave you $12 billion!” — and lucrative tax breaks that “only Trump could’ve gotten you.”
“I’m actually giving you much better than a level playing field!” he proclaimed.
This agri-pandering isn’t unusual, even if Trump is unusually brazen about it. In Washington, D.C., it’s almost mandatory to describe farmers as “hardworking patriots” with “heartland values” while showering them with lavish subsidies, grants, cut-rate loans, price supports, and other agricultural welfare. The Beltway’s relentless efforts to prop up crop-based fuels, which would have no hope of competing with conventional fuels without government help, are the ultimate proof that Big Ag has even more political clout than Big Oil.
But Trump is taking the badness to a new level. While his slogan may be America First, his Agriculture Department’s slogan is Farmers First. Timothy Searchinger of Princeton University, the researcher who exposed biofuels as a deforestation disaster in a 2008 Science paper, estimates the EPA’s new blending requirements will ultimately expand global cropland by at least 28 million acres, an area the size of Ohio.
Two decades ago, when there were no viable alternatives to fossil energy and a documentary called “Who Killed the Electric Car?” was chronicling how General Motors literally scrapped its first alternative vehicles, crop-based fuels looked like the renewable future of transportation. But ever since Searchinger and others showed that those fuels are much worse for the climate than gasoline, and a new generation of electric cars proved to be much better, the federal Renewable Fuel Standard has merely reflected Washington’s determination to increase farm incomes by increasing farm commodity prices. In case there was any doubt about his motives at his Celebration of Agriculture, Trump also canceled a Biden administration effort to extend the Renewable Fuel Standard to electric vehicles, which would have helped the cause of cleaner transportation but not the cause of wealthier farmers.
Again, though, the problem is much bigger than Trump. The world devotes 125 million acres of cropland — an area larger than California — to growing biofuels. (The area is actually even larger, but biofuel production does create useful by-products like animal feed that affect the land accounting.) A recent paper concluded that in Indonesia and Malaysia alone, global demand for biodiesel drove an area of tropical forest larger than Connecticut to be converted into oil palm plantations between 2002 and 2018 — and Indonesia’s own biofuels targets contributed to a 66% jump in deforestation there just last year. Searchinger says that meeting the 2030 biofuels targets already set by major countries would require an additional land mass larger than New Mexico; meeting the International Energy Agency’s global goal of more than doubling biofuel production by 2030 could require another California.
The IEA also envisions a massive surge in renewable fuels in aviation and shipping, from less than 1% of global markets to as much as 15%, a recipe for an almost unfathomable assault on nature. The industry hopes to run half the world’s planes and ships on crops by 2050, which could require new farm fields eight times the size of California. Put another way, nearly one-third of the world’s cropland would be needed to generate a mere 2% of the world’s energy.
I’ve been banging my spoon on my high chair about the badness of biofuels since 2008, when I wrote a Time cover story on corn ethanol headlined “The Clean Energy Scam.” Honestly, the policy arguments are starting to bore me. It’s no longer news that producing biofuels can require nearly as much fossil fuel as they replace. It’s just common sense that when one farm grows fuel instead of food, another farm will expand to grow more food — usually into a carbon-rich forest or wetland, not a parking lot. I spend 50 pages of my latest book, “We Are Eating the Earth,” documenting the various ways scientists, economists, and bureaucrats in Washington, California, the European Union, and even the United Nations Intergovernmental Panel on Climate Change have cooked the books of climate analyses to make biofuels mandates look less catastrophic.
Nevertheless, farm-state Democrats like Sen. Amy Klobuchar of Minnesota and Gov. JB Pritzker of Illinois continue to tout biofuels as greener alternatives to fossil fuels. California under Gov. Gavin Newsom has promoted crop-based fuels through its “Low Carbon Fuel Standard,” even though corn ethanol and soy biodiesel are much higher-carbon than gasoline or conventional diesel. And while a few environmental groups have denounced Trump’s latest favors for the industry, most of the environmental community has remained silent, even as they’ve trashed Trump’s other environmental sins.
I get it. Fighting the farm lobby can feel like a waste of time and political capital. But biofuels are an excellent fight to pick, and now that they’re poised for a gigantic growth spurt in the U.S. and abroad, this would be an excellent time to pick it. Most farmers don’t vote for Democrats anyway. Agricultural expansion is an enormous environmental problem, driving biodiversity loss, nutrient pollution, water shortages, and climate change. And at a time when Americans are furious about high food prices — which helped Trump get elected, and have helped make him unpopular — biofuels mandates are specifically designed to increase the cost of things farmers sell and consumers buy.
None of this will persuade Trump or his Republican lackeys, who don’t care about the climate or the rainforests and won’t do anything to offend their farmer base or agribusiness donors. But it is way past time for serious people who know that biofuels are an insidious boondoggle to start fighting to stop the madness. I’m specifically thinking of three groups that should suit up for battle:
Democrats. There used to be a lot of rural Democrats. There also used to be a deal in Washington: Urban Democrats supported biofuels and other farm goodies as long as Republicans supported food stamps. But rural America is now overwhelmingly Republican, and the GOP’s One Big Beautiful Bill Act blew up the deal, gutting food stamps while blasting even more cash into farm socialism; it even included language ensuring biofuels could still qualify for new subsidies no matter how much they expanded agriculture into nature. So why do Democrats continue to support these environment-wrecking handouts for rich farmers who will never vote for them? Maybe it’s understandable that a corn-state Democrat like Klobuchar is now clamoring to permanently increase the ethanol levels in U.S. gasoline from 10% to 15% in order to cushion the blow from soaring gas prices — though she was clamoring for that long before gas prices were soaring — but why isn’t the rest of the party saying no?
Democrats need a new approach to agriculture, focused less on the 1% of Americans who farm and more on the 100% who eat. That would mean redistributing less money from ordinary taxpayers to the biggest farmers who grow the most common row crops, while also opposing the tariffs, price supports, and biofuel mandates that raise prices at the supermarket. Let Trump stand for giving farmers “much better than a level playing field.” Democrats should stand with everybody else.
Environmentalists. Green groups enthusiastically supported the original Renewable Fuel Standard in 2005, back when biofuels looked like an eco-friendly alternative to fossil fuels. To their credit, most of them stopped pushing farm-grown fuels after Searchinger’s science revealed their downsides. European enviros have actually fought back, successfully limiting crop-based fuels on the continent’s roads and excluding them from “sustainable aviation” mandates. But while a few American groups have also sounded alarms — most notably Friends of the Earth, Earthjustice, the Center for Biological Diversity, and the World Resources Institute — most have been silent, or have lobbied for relatively modest tweaks to state and federal mandates. I found no mention of Trump’s latest expanded biofuels mandate on the websites of the Natural Resources Defense Council, World Wildlife Fund, or Environmental Defense Fund, even though it will have a big impact on natural resources, wildlife, and the environment.
This strategy is designed to avoid alienating the powerful farm lobby, even though Big Ag routinely fights environmentalists over climate, wetlands, toxic chemicals, and other issues. And the strategy hasn’t entirely backfired; although biofuels quickly seized about 3% of the global fuel market by 2010, their market share has remained stagnant ever since. But that’s mostly because of the rise of electric vehicles, and the new push for biofuels in planes and ships, which can’t be easily electrified, is a huge new threat to nature and the climate. That’s what enviros are supposed to fight for, even if it means fighting Big Ag.
International institutions. In “We Are Eating the Earth,” I quote several scientists who worked on IPCC reports complaining that their panels were stacked with biofuels advocates who fought desperately to make sure the fuels were endorsed as climate solutions. Someone could write a whole book about that alone, but the long story short is that IPCC reports tend to point out that critics believe crop-based biofuels won’t reduce emissions at all, while supporters believe biofuels can reduce ludicrously massive amounts of emissions — and then suggest the world should aim for something in between to achieve its net-zero goals, which still amounts to a pro-biofuels stance. The IEA and other global institutions have taken a similar approach.
The scientists who still claim biofuels are good for the climate tend to assume they’ll make food so expensive that poor people won’t be able to afford as much meat, which would be bad; or that higher crop prices will miraculously enable farmers to grow way more crops without using more land, which isn’t grounded in empirical reality; or that farmers who do clear more land will somehow avoid carbon-rich forests, which is more wishful thinking. The science is clear, even if it isn’t comforting. It’s true that net-zero will be much harder to achieve if we can’t assume emissions reductions from biofuels. Unfortunately, we can’t, and the sooner credible institutions recognize that, the better.
So that’s my advice. Democrats should stop trying to suck up to farmers who will never love them back. Enviros should stop shying away from a war with Washington’s most powerful lobby. And climate institutions should abandon the most politically popular climate solution even though it will make climate progress look even less achievable.
I can’t pretend that any of this will be easy. If it were, it would’ve happened already. The fact that biofuels are crass political payoffs is one of those things just about everybody in Washington knows but hardly anybody wants to try to change. I’m genuinely not sure change is possible, but I’m sure it won’t happen if nobody tries.
It’s not an easy moment for renewable energy in the U.S., but the sector is still setting new records.
Just look at what happened last month: Over the course of March, the nation got more electricity from renewables than it did from natural gas, which is typically the single-largest source of energy on the U.S. grid.
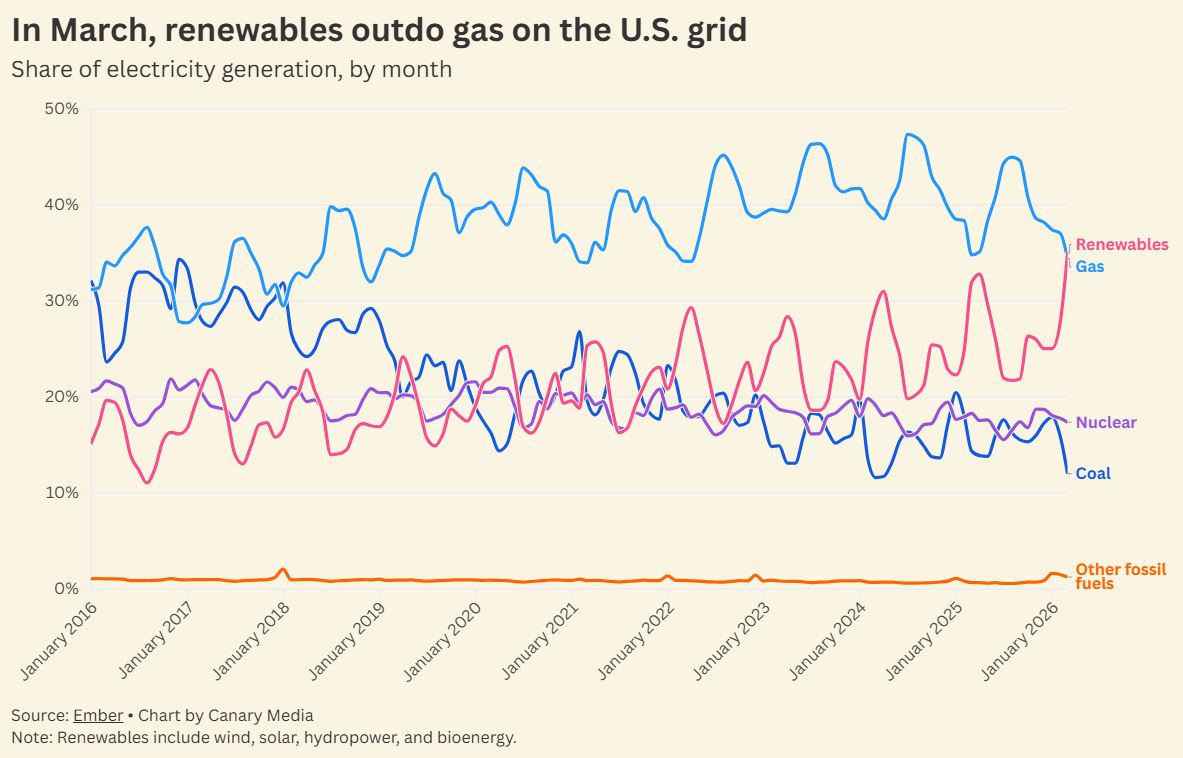
It’s the first time renewables have bested the fossil fuel in the U.S. across an entire month, per data pulled from the think tank Ember. Meanwhile, emissions-free sources, a category that includes both renewables and nuclear, produced more than half of the nation’s electricity. It’s just the third time that’s happened across an entire month, the first instance being last March.
Sure, renewables only beat gas across a short time frame. And, yes, March is the start of the spring shoulder season, when electricity demand falls a bit from its winter highs and renewables tend to outperform.
But it’s a major milestone despite these caveats. Just five years ago, the gap between gas and even the best months for renewables was yawning. Since then, that gap has narrowed, thanks in large part to the rapid expansion of solar and the steady growth of wind power. Hydropower, bioenergy, and other sources of renewable energy have seen their combined share of electricity production slowly decline over the same time period.
Renewables have crossed this threshold amid serious political pushback. The Trump administration has relentlessly attacked the sector — especially wind — over the last year and change. Its policy shifts are likely to result in fewer new solar and wind farms over the medium term, but in the short term, they haven’t really derailed the growth of clean energy. In fact, March was the best-ever month for wind in terms of electricity output.
But perhaps more impressive is that renewables are growing their market share while overall electricity demand climbs. Put simply, clean energy is taking a bigger slice of a growing pie.
Gas power plants, for their part, remain difficult to build due to supply chain bottlenecks. Meanwhile, solar, batteries, and wind together will once again make up the overwhelming majority of new energy capacity added to the grid this year. The same was true last year. And the year before. And the year before that…
Even as the Trump administration creates obstacles to building renewables, a key pair of facts will hold: The U.S. needs more electricity, and renewables are the easiest way to get it. In other words, don’t expect this to be the last month in which renewables conquer gas.
In Washington state, the Trump administration’s crusade to force aging coal plants to stay online is meeting resistance from lawmakers — and confronting the reality that the state’s power grid is doing just fine without coal.
On Monday, the Department of Energy issued its second 90-day emergency order demanding the continued operation of Unit 2 of TransAlta’s power plant in Centralia, in southwestern Washington. The DOE had first ordered the facility to keep running in December, the same month it was set to stop burning coal under an agreement with the state that’s been in place since 2011.
The order comes less than one week after Gov. Bob Ferguson, a Democrat, signed legislation that would impose hefty costs on TransAlta should the Centralia facility begin running again. The law, which passed Washington’s Democratic-controlled legislature in February, revokes TransAlta’s exemption from a requirement to buy allowances under the state’s cap-and-trade program. It also eliminates an exemption that allowed TransAlta to avoid paying the state sales tax on the coal it burns at the Centralia plant.
These changes will make it “extremely expensive for them to generate power at that facility,” Washington state Rep. Joe Fitzgibbon, the bill’s lead sponsor, told Heatmap News last week. Fitzgibbon, a Democrat, added that the goal was to forestall the threat of the Trump administration getting “more aggressive” in its use of emergency power by putting the state “in a stronger position to ensure that the plant did not restart operations.”
The DOE has trotted out familiar justifications for ordering the Centralia plant to continue operating. The Monday order stated that the “reliable supply of power from the Centralia plant is essential to maintaining grid stability across the Northwest, and this order ensures that the region avoids unnecessary blackout risks and costs.”
But no such risks exist. According to an Environmental Defense Fund analysis of power generation data from the DOE’s Energy Information Administration, the Centralia plant hasn’t generated any meaningful electric power since January. The state has not suffered from any grid emergencies or supply shortfalls so far this year.
“The data proves that forcing this coal plant to stay open is just a wasteful charade,” Ted Kelly, the Environmental Defense Fund’s director and lead counsel for U.S. clean energy, said in a Tuesday press release. “The Centralia plant hasn’t been producing any power over this supposed ‘emergency’ period because the grid has more than enough electricity without it — yet families and businesses will bear the costs of keeping it operational.”
There’s little reason to expect the state will need the power plant over the next three months, either, Kelly told Canary Media. “We’re heading into the spring period, when there’s generally less demand than during the winter period, and at a time when we have robust hydropower reserves,” he said.
TransAlta President and CEO John Kousinioris echoed this view in a February earnings call. He said that the company was “fully in compliance with the order in the sense of being available, should we be asked to run.” However, he added that TransAlta doesn’t expect to operate the plant this spring, given “how flush the hydro situation is in Washington state right now.”
TransAlta is one of six fossil-fueled power plants forced to remain in operation by Energy Secretary Chris Wright under Section 202(c) of the Federal Power Act. Before last year, DOE had used that emergency authority only temporarily on request from utilities and grid operators facing immediate energy threats.
Wright has taken the unprecedented step of invoking this authority to prevent the closure of power plants that utilities and grid operators have determined were too costly to keep open and weren’t needed to maintain grid reliability. He also appears to be using it indefinitely.
The agency has issued three continuous 90-day orders to force a coal plant in Michigan and an oil- and fossil-gas-fired plant in Pennsylvania to keep running. It is expected to soon extend the forced operations of a coal plant in Colorado and two coal plants in Indiana.
Meanwhile, the costs of restarting operations at plants on the verge of being shut down are mounting — and will be borne by customers who are already struggling with rising utility bills The Sierra Club estimates that DOE’s orders have added up to $269 million as of Tuesday afternoon. DOE’s orders have been silent on how to assign those costs, leading state utility regulators and grid operators to dispute how to apportion them out to utility customers across their regions.
Washington state operates under a set of regulatory and energy market structures that complicate the matter of forcing TransAlta to generate power and foist those costs on utility customers. The Centralia facility is a “merchant” plant, meaning it cannot recover the cost of fuel and maintenance from captive utility customers, and must sign contracts with utilities or other energy buyers to earn enough money to stay open.
For the past decade, Washington state and TransAlta have planned to convert the Centralia plant to run on fossil gas. Kousinioris said last month that this plan remains in place. TransAlta has also secured an agreement to sell future gas-fired energy to utility Puget Sound Energy, he said. Meanwhile, the company has no contracted customers for the plant’s coal-fired power, making it unclear how it would be compensated if forced to generate that power.
Critics accuse the DOE of twisting the law and fabricating grid emergencies to serve the Trump administration’s pro-coal agenda. State attorneys general and environmental groups have brought legal challenges against each of DOE’s must-run orders. The first of these challenges, to DOE’s order for the J.H. Campbell coal plant in Michigan, now awaits a hearing in the U.S. Court of Appeals for the D.C. Circuit.
In a Tuesday email, a DOE spokesperson did not address Canary Media’s questions regarding the critiques raised by these legal challenges, stating that such questions could be answered by reading the agency’s orders. “The Trump Administration is committed to preventing the premature retirement of baseload power plants and building as much reliable, dispatchable generation as possible to achieve energy dominance,” the spokesperson said.
The DOE has not responded to a clarification request from environmental groups on how the agency plans to use its Section 202(c) authority as the language of the law intends. That includes ensuring it forces the Centralia plant to operate “only as necessary to address a ‘loss of power to homes, businesses, and facilities critical to the national defense,’” as DOE’s order states it will do.
DOE has relied on broad and unsubstantiated claims of the risk of longer-term grid supply shortfalls to justify its emergency must-run orders, in Washington state and beyond. But the underlying law that the DOE is using doesn’t allow that, Kelly said.
“The core point here is that 202(c) is intended for real emergency situations, like an act of war, which is specified in the statute, or extreme weather situations that require specific responses,” he said. “Never before this administration has it been used as some sort of long-term planning tool.”
The legal challenges against DOE make this point clear, he said. “We hope we’ll see strong decisions that show how 202(c) is meant to be used and overturn these unlawful orders.”
A new study, led by researchers at Columbia University and Woods Hole Oceanographic Institution (WHOI), identifies a diverse set of molecules released by marine phytoplankton that fuel microbial life and help drive Earth’s carbon cycle. While scientists know that carbon is moved through an invisible network of phytoplankton and other microbes in the surface ocean, the specific compounds have long been a mystery. These compounds are small, chemically difficult to detect in salty seawater, and are rapidly consumed by other organisms almost as soon as they are produced.
Phytoplankton, a type of microscopic organism, take in carbon dioxide and convert it into organic carbon through photosynthesis, like plants. Each year, this process moves many tens of billions of tons of carbon through the sunlit surface ocean and contributes to the oxygen in the air we breathe. These massive natural carbon flows highlight the central role the surface ocean plays in regulating Earth’s carbon cycle.
“For this study, we placed six phytoplankton species representing major groups of marine phytoplankton under controlled conditions. They had the nutrients and light they needed to grow,” said Yuting Zhu, co-lead author of the study and former WHOI postdoctoral investigator, now with Old Dominion University. “Using a chemical-tagging method developed at WHOI, we were able to quantify the composition of biologically available small molecules released by globally abundant microorganisms.”
These compounds accounted for up to 23% of the dissolved organic carbon that phytoplankton released and may support a substantial share of microbial metabolism in the global ocean.
However, many bacteria are metabolic specialists, or picky eaters. The study found that different phytoplankton species release distinct combinations of metabolites, including carbon compounds also containing nitrogen, phosphorus, and sulfur. Because bacteria vary in which molecules they can consume, the chemical “menu” produced by phytoplankton helps determine which microbial communities thrive in different parts of the ocean.
“The findings help illuminate a long-standing mystery about the composition of the ‘chemical currencies’ that are moved by microbes in the surface ocean,” said microbial oceanographer Sonya Dyhrman, a researcher at Lamont-Doherty Earth Observatory, which is part of the Columbia Climate School, and professor of Earth and environmental sciences. “I think of it as a microbial carbon economy. By identifying the currencies produced by phytoplankton, scientists can begin to build more realistic representations of how marine microbial communities cycle billions of tons of carbon.”
To explore the broader implications, the team, also including researchers from the Massachusetts Institute of Technology and Marine Biological Laboratory, combined laboratory measurements with global ecosystem modeling. Their results suggest that phytoplankton-derived metabolites could supply up to 5 percent of the daily carbon needs of SAR11, one of the most abundant groups of bacteria in the surface ocean.
“Combining the ecological and chemical approaches here allowed us to view the system through a new lens,” said co-lead author Hanna Anderson, a researcher at Lamont and PhD candidate in Earth and environmental sciences at Columbia. “Thinking synthetically about how these carbon substrates can mediate interactions between phytoplankton and heterotrophs, which in turn cycle this carbon within the marine food web.”
The research was conducted as part of the National Science Foundation-funded Center for Chemical Currencies of a Microbial Planet, a science and technology center that investigates how small molecules govern interactions among microorganisms across Earth’s ecosystems.
“Understanding these exchanges is critical because a huge portion of Earth’s carbon cycle passes through this microbial system, but we still don’t fully understand it,” said the center’s director and co-author of the study, WHOI senior scientist Elizabeth Kujawinski. “If we understand what molecules phytoplankton release and what molecules bacteria can take up, we can start building models of how these organisms interact. We think of the surface ocean as a network, where phytoplankton and bacteria are connected by molecules—some compounds feed many different bacteria, while others only support a few.”
Future studies will investigate how environmental conditions such as nutrient limitation, temperature changes, and ocean acidification alter the molecules that phytoplankton release and how microbial communities respond to those “chemical currencies.”
This article was adapted from a press release by the Woods Hole Oceanographic Institution.
Across the country, state lawmakers are considering ways to address the risks posed by the explosion of power-hungry data centers. They have proposed an array of bills to impose moratoriums on data center development, revoke tax breaks, force data centers to pay for new energy infrastructure, and enact other safeguards.
In Illinois, lawmakers and renewable advocates are especially concerned that data centers could derail the state’s transition to 100% clean energy, since there’s likely not enough renewable sources in the state to meet data centers’ projected demand.
The Protecting Our Water, Energy, and Ratepayers Act, or POWER Act, aims to persuade data centers to pay to build enough new clean energy for sustaining their operations. This should shield customers from rising prices when overall electricity demand increases, proponents of the measure say, and it would ensure that the state’s coal and gas plants don’t need to run past their planned retirement dates just to fuel data centers.
The bill, introduced in February, would entice data centers to make clean energy investments by offering them two of the things such operations most prize: fast interconnection to the grid and uninterrupted power.
Stakeholders involved in crafting the bill said the incentive structure is meant to keep Illinois attractive to data centers, while defending the state’s clean energy shift and customers’ wallets. The facilities could account for between 64% and 72% of energy demand growth in the state by 2030, according to a recent report by the Union of Concerned Scientists, a nonprofit science advocacy group.
Illinois law mandates ending fossil fuel generation by 2045, but unchecked data center growth could cause continued reliance on the state’s fossil-fueled plants — allowed by law if the power is needed — and the importing of dirty power from elsewhere, the report explains.
The bill’s advocates are calling the approach BYONCCE, pronounced like the singer’s name but meaning “bring your own new clean capacity and energy.” (A similar term has been used in other states, sometimes referring to “carbon-free energy.”)
While the addition of new clean energy should help prevent a rise in electricity costs for regular customers, the bill also has other components to keep rates low. It requires data centers to pay for grid upgrades such as the transmission lines and substations needed to serve them. It demands that data centers pay into a “public benefits and affordability fund” that can be used to assist low-income households with utility costs and for environmental justice initiatives; each data center would pay an amount based on its peak demand. The bill also creates a compensation fund for community groups intervening in regulatory proceedings around data centers, helping them push for clean energy and customer protection in individual cases.
“We’re in a new world all of a sudden where demand has gone off the wall,” said MeLena Hessel, Midwest deputy program director of Vote Solar, a nonprofit policy-advocacy organization. “Writ large, we’re trying to figure out how can we get to large loads bringing their own new clean energy and capacity in ways that matter and keep costs lower for customers.”
Supporters of the bill emphasize that while the legislation provides incentives for data centers to develop clean energy, it does not actually force them to do so.
If the power-hungry facilities don’t provide their own energy, they would have to wait, along with all the other large users, in a potentially long line to get connected to the grid. The bill calls for data centers to submit a clean energy supply plan to regulators. If that plan shows that the data center has procured 80% of its predicted annual power demand from new clean energy by 2030 and 100% by 2045, it would receive “fast-track” grid connection.
“We want to encourage data center companies to be clean energy champions, and those that are really excelling are able to jump the queue,” said Kavi Chintam, Vote Solar’s Illinois campaign manager. “That is the incentive that data center companies need and want now.”
Data centers that don’t build enough clean energy could see their electricity curtailed during times of high demand. The bill empowers utilities to take such action as a way to protect other customers from increased prices when the energy supply is tight. That threat is further motivation for data centers to invest in clean energy.
Facilities that pay to build or acquire as much clean energy as they expect to use are guaranteed uninterrupted access to that same amount of power. Solar and wind, as well as battery storage, virtual power plants, and demand-response measures — such as reducing energy use when the grid is stressed — qualify toward that total. Data centers would still be subject to any emergency energy curtailment — like rolling brownouts or blackouts — ordered by regional grid operators.
Illinois has a restructured energy market, in which utility companies do not own generation and instead procure power on the open market to serve customers. In neighboring Wisconsin and Indiana and other states with vertically integrated energy markets, by contrast, utilities pay to build needed generation and pass on the costs to their customers.
Regulators in Illinois and other states with restructured markets may have fewer options to determine how data centers are charged for generation infrastructure, since that is not the purview of the utilities they oversee. In Illinois, management of the flow of electricity on the grid — which utilities do control — is the way to influence data centers’ behavior, said James Gignac, who is the Midwest policy director for the Union of Concerned Scientists’ climate and energy program and one of the authors of its recent report.
“Offering compelling incentives for what the data centers wish to have is our approach,” Gignac said. “They are looking for firm service and the quickest way possible to connect to the power grid. By challenging data centers to meet these higher levels of clean energy, we can recruit the most responsible data center operators to Illinois.”
The Data Center Coalition, a trade group that represents developers of the facilities, and the Illinois Chamber of Commerce, which promotes investment in the state, did not respond to queries for this story.
Three times in the last decade, Illinois’ clean energy supporters and industry representatives have worked closely with lawmakers to pass sweeping energy bills. A 2017 law created ambitious renewable-energy mandates and job creation programs, a 2021 law bolstered clean energy and equity targets, and a law passed last fall addressed the need for much more energy storage on the grid. Those three pieces of legislation were spearheaded by legislators working with the Illinois Clean Jobs Coalition, including dozens of advocates for consumers, clean energy, and environmental justice. That coalition is also backing the data center bill.
Coalition members described the POWER Act as a similarly ambitious measure, which will likely go through a long process of consensus-building.
In addition to the clean power and affordability provisions, the bill includes other safeguards, like mandates for water resource planning and quarterly water-use reports. It prohibits nondisclosure agreements with data centers, mandates community benefit agreements, and requires a proposed data center’s cumulative impact to be examined in the context of other existing or proposed burdens on local residents.
Illinois’ legislative session ends in late May, and bills can also pass in a fall veto session or a special session called by the governor.
Proponents of consumer protection and clean energy say it is crucial for a data center–focused bill to pass soon, since numerous such facilities for powering AI are proposed in the state. The Chicago region, in particular, is already home to around 200 data centers, according to the organization Data Center Map, and more could be in the works. A $20 billion data center proposal was recently approved by local officials southwest of Chicago, in Joliet, for example. In February, Democratic Gov. JB Pritzker called for a two-year pause on state tax incentives for data centers in response to the growing concern from communities.
“This is an urgent problem,” Chintam said. “We need to do something now.”
A correction was made on March 12, 2026: A previous version of this story misrepresented the Union of Concerned Scientists’ prediction for data center energy demand in Illinois by 2030. Data centers could account for between 64% and 72% of growth in demand by that time, not total demand.
Last year, Southern California’s air regulators rejected landmark rules that would have encouraged the switch from polluting gas heaters to electric heat pumps in the smoggiest region in the country. Now, environmental and public health advocates are pressing state and local officials to investigate whether opposition in the run-up to the decision was largely faked.
Members of the regulatory board voted 7–5 against the proposed rules in June, after receiving more than 20,000 public comments opposing them. It was “an unusually high number,” said Rainbow Yeung, spokesperson for the South Coast Air Quality Management District, which regulates the air quality for more than 17 million residents across Los Angeles, Orange, Riverside, and San Bernardino counties.
A Los Angeles Times investigation revealed that an advocacy software firm called CiviClick had been hired by a public affairs consultant with industry ties to deliver the large volume of emails — and raised questions about their legitimacy. The deluge “almost certainly” influenced the board’s decision, the L.A. Times reported, adding that most agenda items seen by the agency receive comments numbering in the single digits.
“It is … both shocking and concerning to learn that an agency responsible for regulating the air quality for nearly half of California’s population could have had the integrity of their public process compromised by comments made without people’s consent,” Gracyna Mohabir, clean air and energy regulatory advocate at the nonprofit California Environmental Voters, said during a February press conference with reporters.
Advocates are asking California Attorney General Rob Bonta and Los Angeles District Attorney Nathan Hochman to investigate whether CiviClick and others committed fraud to prevent the clean air rules from passing. As of Friday, no formal investigation had yet been launched. In the meantime, the SCAQMD itself has attempted to verify opposition letters, but those efforts have been inconclusive so far.
The agency’s rules would have ramped down the sale of new gas heaters but not banned them. The proposals would have encouraged manufacturers to gradually increase sales of superefficient electric heat pumps and heat-pump water heaters until they represented 30% of heater sales by 2027 and 90% by 2036. These manufacturers would have also paid a partial mitigation fee of $50 to $500 per gas appliance sold — and likely passed that fee on to customers who still opted for gas.
Still, the rules would have made an enormous difference for Southern Californians. By slashing emissions of smog-forming nitrogen oxides by 6 tons per day by 2060, the agency estimated, the regulations would have saved $25 billion in health costs from 2027 to 2053 — and about 2,500 lives.
Last June after their decision, regulators kicked the proposals back to a subgroup committee for further discussion. They have not announced a timeline to revisit the rules.
In the months leading up to the air district’s vote, the utility Southern California Gas Co., or SoCalGas, and allied groups spread misleading information about the rules, and encouraged mayors and other public officials to send letters, testify, and pass local resolutions railing against the measures.
Now, it’s clear that a key figure rallying opposition was Matt Klink, a public affairs consultant who ran a targeted campaign that resulted in the avalanche of comments now under scrutiny. Klink is a partner at California Strategies, one of the state’s most powerful lobbying firms, whose clients include Sempra, the parent company of SoCalGas.
Klink contracted with CiviClick, which has billed itself as “the first and best AI-powered grassroots advocacy platform,” to generate opposition comments. The platform “made the ultimate difference,” Klink said in a sponsored August article in Campaigns & Elections magazine. He did not respond to Canary Media’s multiple requests for comment.
CiviClick “knew the local targets who would respond to the messaging that was constructed … [And the firm] said, ‘these are the results that we guarantee,’” Klink said in the article. “We did two separate rounds of outreach, and they met the targets in both rounds early. AQMD staff are not used to getting tens of thousands of emails so it made a massive difference in turning the tide.”
In North Carolina, CiviClick is separately facing scrutiny for its involvement in producing mass emails supporting a proposed gas pipeline. Two local county commissioners replied to what they thought were emails from their constituents, only to learn that those individuals hadn’t sent the messages and didn’t know what the commissioners were talking about, E&E News reported in 2025.
SCAQMD staff (not to be confused with the 13 voting board members) found elements of the submissions “disturbing,” as the agency’s executive officer Wayne Nastri put it. Among those discrepancies: an email thanking Nastri himself for his supposed opposition to one of the rules his agency had crafted.
The air district also received multiple messages from the same CiviClick email address — constituent@civiclick.com — made to look as if they were sent by different individuals.
Agency staff members reached out to 172 people whose names were on submitted comments, to verify they were aware of the submissions. But the response rate was low.
“We received five total responses, two of which confirmed they sent letters and three of which had no knowledge of the letters,” Yeung said in an email. “The limited number of confirmations did not allow us to draw a definitive conclusion regarding the authenticity of the entire batch.”
The agency is considering a “more aggressive” way to check the veracity of the comments, Nastri said at the air district board meeting in March. It’s also looking at longer-term fixes such as instituting a secure comment portal.
“This has a lot of attention from a lot of different parties,” Nastri told the board. “I’m sure that we will be working with many people as we continue to address this.”
The controversy highlights mounting fears that interest groups could wield generative AI tools to give the semblance of strong public sentiment where it doesn’t exist.
The L.A. Times reporting initially suggested that CiviClick used AI for the SCAQMD opposition campaign. The firm’s founder and CEO, Chazz Clevinger, has since denied employing such tools in this instance to both the L.A. Times and Canary Media, although he confirmed his company does offer clients AI capabilities to personalize messages.
Local officials elsewhere are facing fraudulent public comments that may or may not have been AI-generated.
In the Bay Area, for example, air regulators received emails opposing air-quality rules last year as a part of a campaign run by a firm that advertises its AI capability, Speak4. Ten individuals identified as having sent opposition comments said they never did so, the San Francisco Chronicle reported last Thursday.
Clean air advocates in Southern California are demanding an investigation in the SCAQMD case to uncover whether identity theft was committed.
“I’m highly skeptical that CiviClick did not use AI to generate the comments, and their denial only increases the importance of a formal investigation into the comments, how they were generated, and whether individuals signed on consented to be included,” said Dylan Plummer, Clean Heat Campaign adviser for the Sierra Club.
The results are important both for this particular case, advocates said, and for the inevitable battles over regulatory proposals to come.
“This really is about the precedent going forward,” said Chris Chavez, deputy policy director of the statewide Coalition for Clean Air. “We need to make sure that we’re taking steps not just to protect our clean air, but [to] protect our regulatory process … to make sure that we can respond to the threats in our communities.”

.svg)
